The global equity market started off August sharply lower due to Fitch downgrading the US’s debt rating and soft economic data from China. The global equity market fell by 2.31% led by sharp declines of the European and emerging markets. The European market fell by 2.38% as ECB continues to indicate further raising of interest rates to fight against inflation, albeit inflation is declining, while the emerging markets fell by 2.36% caused by a slowing Chinese economy and lack of stimulus. The Chinese market declined by 1.12%. As sentiments turned to risk-off, the global fixed income market fell by 0.83%, outperforming the global equity market.
Figure 1: Major Indices Performances
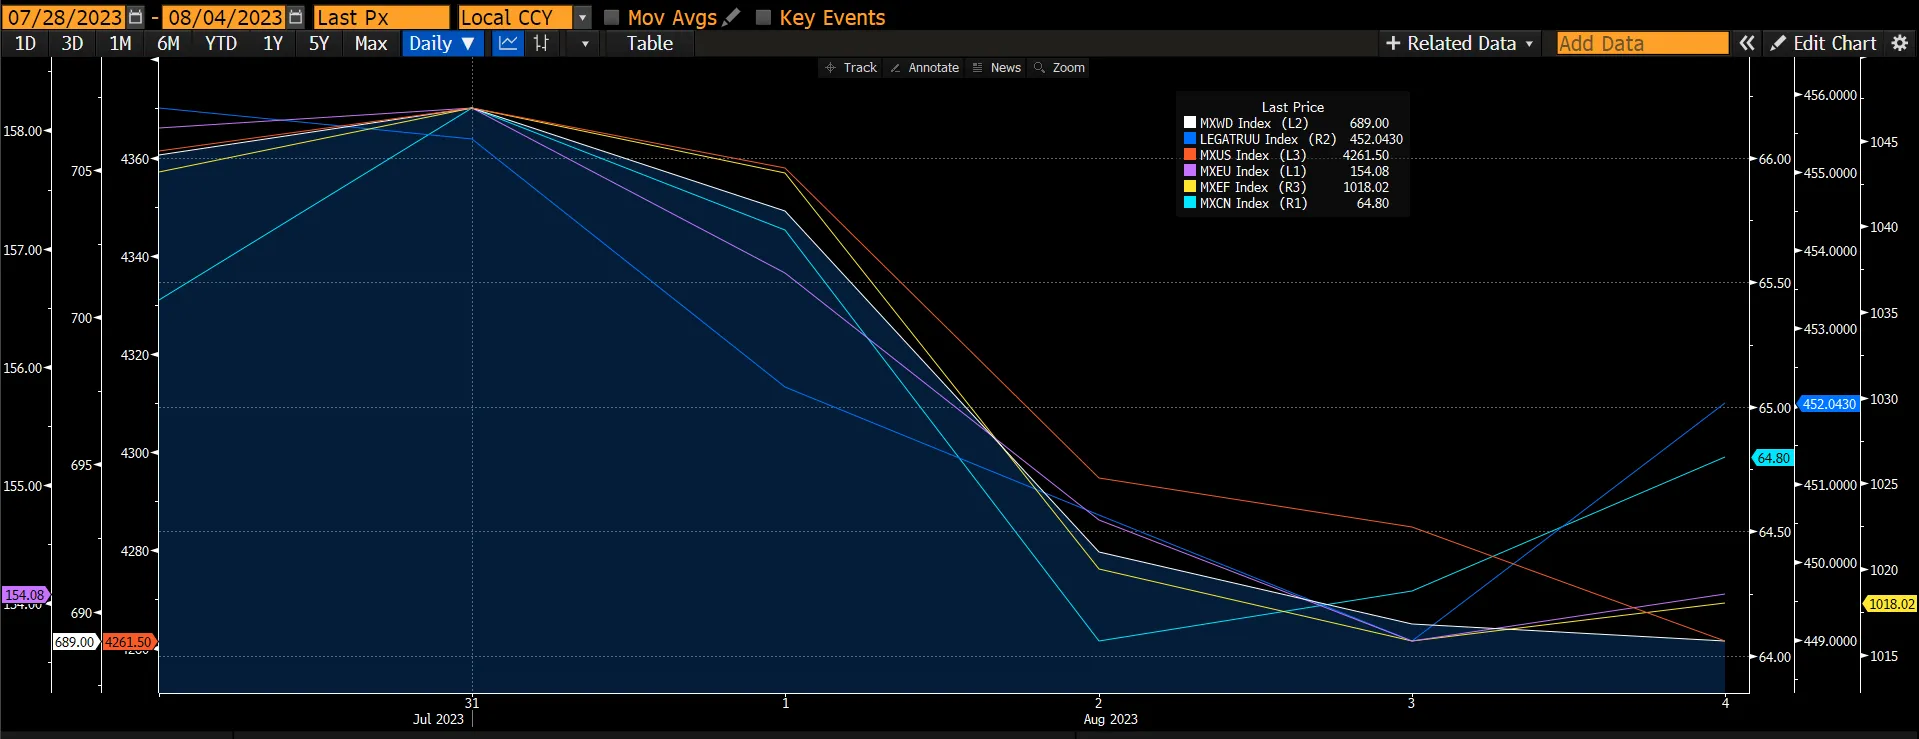 Source: Bloomberg
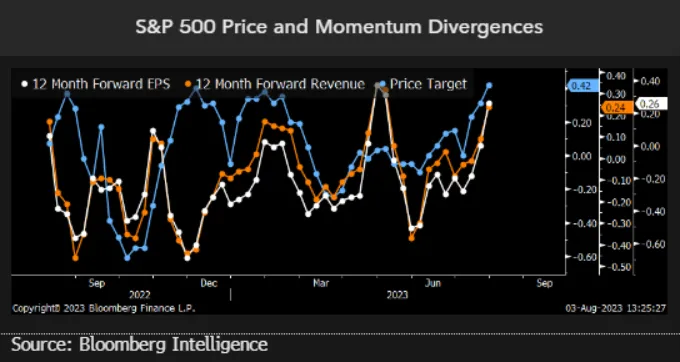
Fitch's downgrade of the US debt rating has gotten a lot of attention as the proximate cause of stocks' malaise, but technical factors suggest the market was due for a pause, no matter what was in the news cycle this week. On the back of the announcement, the US market declined by 4 straight days. Furthermore, the debt downgrade of 2011 has entered the market narrative, but we believe that year offers no lesson for what to expect given the global debt-default fears and monetary-policy movements that dominated risk tolerance then. Also, this earnings season is doing its part to minimize the decline this time as forward 12-month net-revision momentum for EPS and revenue are each approaching 1Q reporting season peaks.
Figure 2: Earnings Revision Being Raised
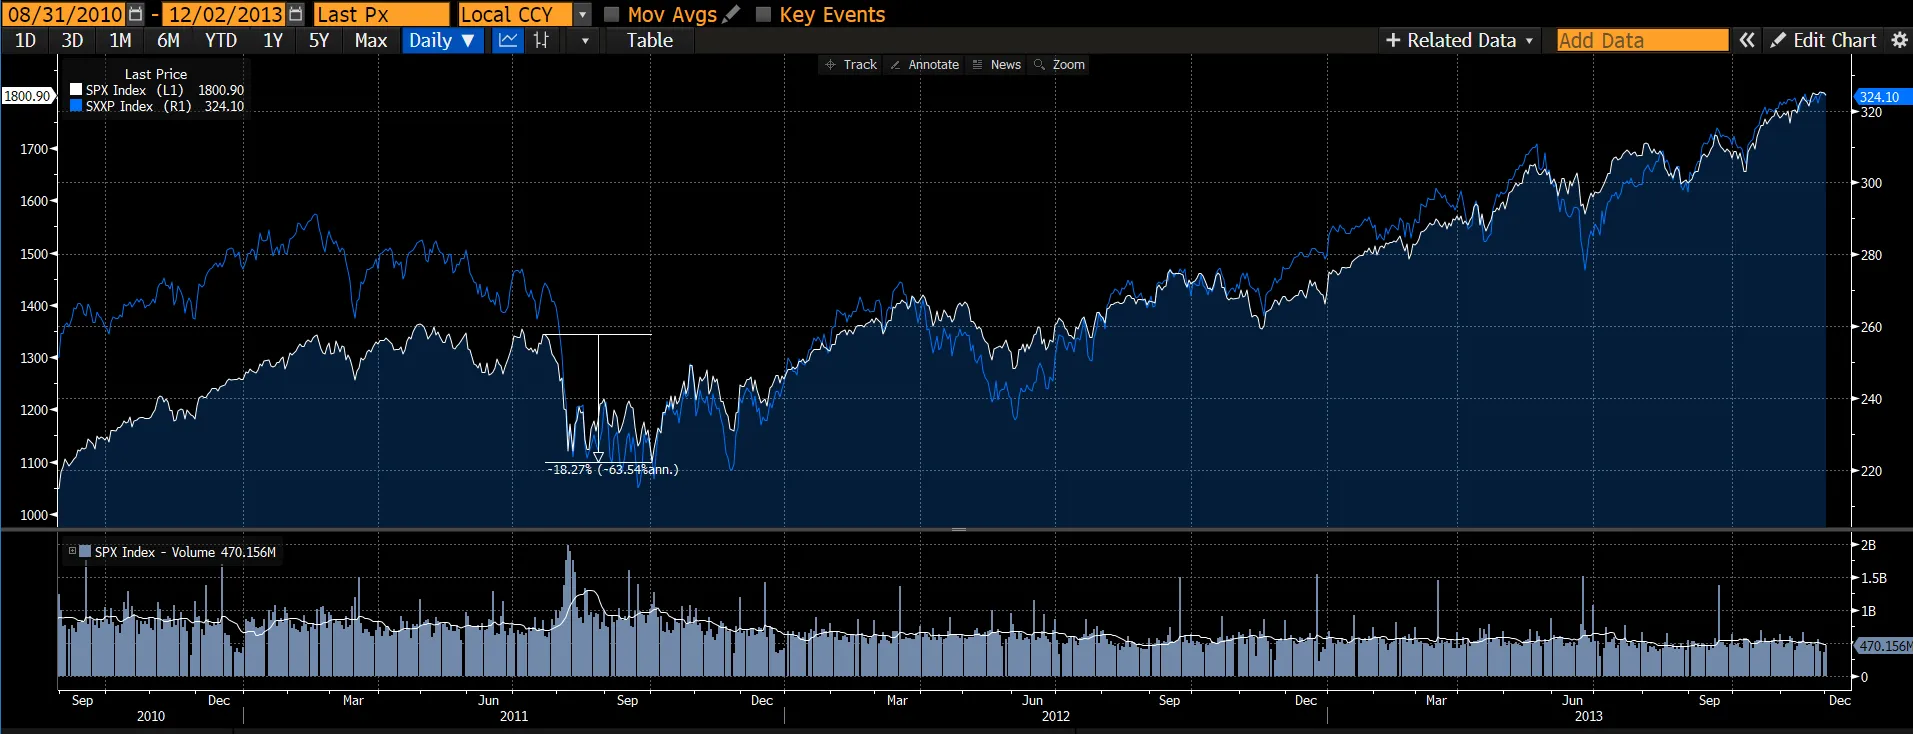
The US debt-rating downgrade has sparked many comparisons to 2011, when stocks corrected nearly 20%, but given extreme differences in the economic landscape, references to the period seem off base. Recall that a global debt crisis plagued stocks in 2011, with Europe's periphery a serious source of concern for financial markets at large. At the time, yields on government debt for the PIIGS nations (Portugal, Ireland, Italy, Greece, and Spain) were surging to extremes, creating fears of a second global financial crisis and accompanying economic meltdown. Likewise, the US Federal Reserve was experimenting with an alternative monetary policy -- Operation Twist -- which created high anxiety for financial markets. That said, the US market took 2-3months before recovering strongly.
Figure 3: SPX 2011 And STOXX 600 Performances
Meanwhile, the US ISM services index decreased by 1.2pt to 52.7 in July, below consensus expectations for a 0.8pt decrease. The underlying composition was weak, as the business activity (-2.1pt to 57.1), new orders (-0.5pt to 55.0), and employment (-2.4pt to 50.7) components all decreased. Although the supplier deliveries component increased by 0.5pt to 48.1, the new export orders index decreased by 0.4pt to 61.1. Factory orders increased by 2.3% in June, in line with consensus expectations. Manufacturing inventories were flat in June. These data do suggest some signs of weakness in domestic and global demand.
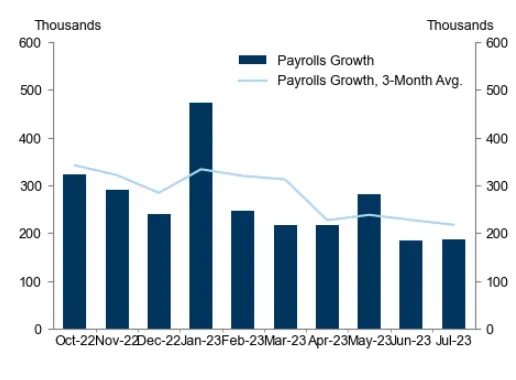
On 4 August, nonfarm payrolls rose 187k in July and were revised 49k lower over the prior months. The household survey was strong, with the unemployment rate falling back to the cycle low of 3.5%, driven by a 268k gain in household employment. Average hourly earnings surprised on the upside at 4.4% YoY (vs. expectations of 4.2%). From this data, it is still early to determine if the Fed would hold or raise interest rates. Currently, the market is pricing in only a 16% chance of the Fed raising its interest rates at its September meeting.
Figure 4: Payroll Continues To Grow
 Source: Department Of Labour
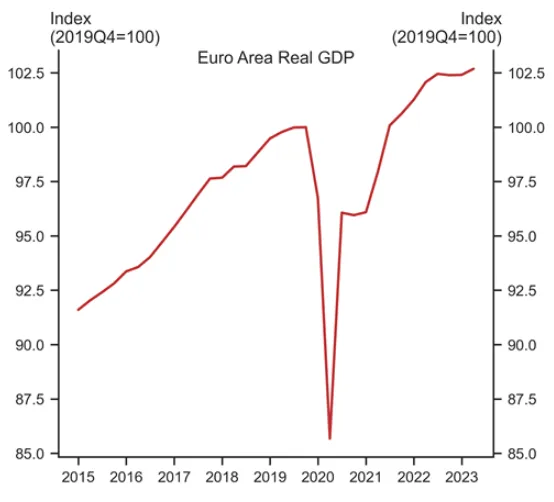
In the Eurozone, core HICP inflation rose 2bps to 5.49% YoY, above consensus expectations while headline HICP inflation fell 21bp to 5.31% YoY, in line with consensus expectations. Nevertheless, as the inflation remains above the target level of 2% and ECB’s decision to raise rates would be data dependent, the likelihood of further hikes in the upcoming meeting cannot be ruled out. Furthermore, according to the preliminary flash estimate, Euro area real GDP increased by 0.3% QoQ in 2Q which is above consensus expectations. Among Euro area countries that have reported 2Q GDP so far, all countries showed growth, except for Austria, Italy, and Latvia, which recorded a decline of -0.4%, -0.3%, and -0.6% respectively. Overall, Euro area real GDP now stands 2.7% above its pre-pandemic (4Q19) level, reflecting the economy remains robust. We would look for economists to upgrade their GDP forecast upon the full release of the economic data. Currently, the market is factoring in a 36% chance of a rate hike at the September meeting.
Figure 5: Eurozone GDP Above Expectations
 Source: Eurostat, Istat, INE, Destatis, INSEE, GS
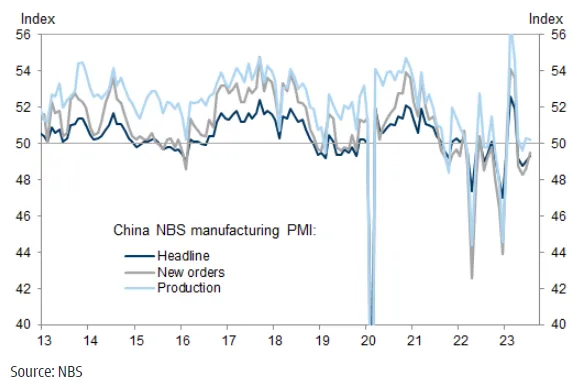
Data out of China is still soft. The China NBS purchasing managers’ index (PMIs) survey suggested manufacturing activity remained soft in July. The NBS manufacturing PMI headline index rose slightly to 49.3 in July from 49.0 in June. Among five major sub-indexes, the new orders sub-index increased to 49.5 from 48.6 while the output and employment sub-indexes edged down to 50.2 and 48.1 from 50.3 and 48.2 in June, respectively. The suppliers' delivery times sub-index edged up to 50.5 in July from 50.4 in June, suggesting the ongoing improvement in supplier deliveries. The NBS commented that some key sectors such as petroleum and coal processing, chemical fiber and plastic, and special equipment continued to expand in July. However, the NBS also indicated that insufficient demand both domestically and externally was the main challenge firms faced.
The official non-manufacturing PMI (comprising the services and construction sectors) fell to 51.5 in July (vs. 53.2 in June), suggesting both the construction and services sectors continued to recover sequentially, but at a slower sequential pace. The services PMI slowed to 51.5 (vs. 52.8 in June). According to the survey, the PMIs of service industries such as airlines transport, postal, IT, and telecommunication were above 60 while the PMIs in the capital market and property sectors were below 50 in July. The construction PMI fell notably to 51.2 in July (vs. 55.7 in June), mainly dragged by adverse weather such as high temperature and heavy rainfall.
Figure 6: China Office PMI
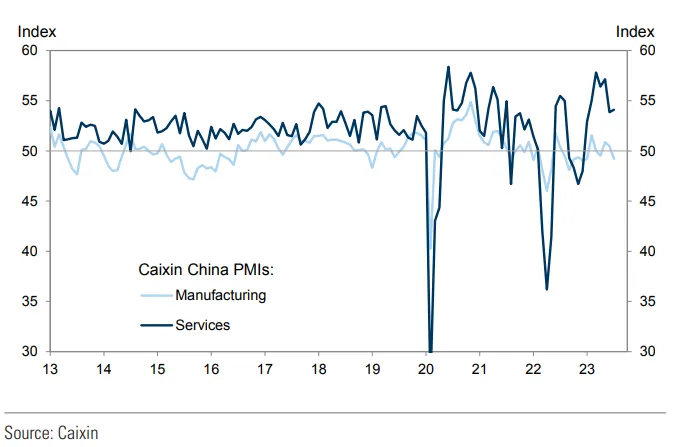
The Caixin China General Services Business Activity Index (headline services PMI) rose to 54.1 in July from 53.9 in June, suggesting the activity in the services sector continued to improve at a solid pace. The NBS services PMI fell while the Caixin services PMI edged higher, leading to a wider gap between these two PMIs in June.
Price indicators suggest services-related cost inflation pressure eased slightly in July. The output prices sub-index decreased to 50.8 from 51.1 and the input prices sub-index fell to 52.3 from 52.8 in June. Surveyed companies indicated that raw materials, labour costs, transportation, and accommodation fees contributed to the increase in operating expenses, and efforts to remain competitive had limited service providers’ overall pricing power to some degree.
Figure 7: Caixin PMI
Notwithstanding the downgrade in credit rating by Fitch, we believe investors will begin to switch their focus back onto this earnings season with better-than-expected earnings growth and upward earnings revision momentum. We believe this recent consolidation will be short-lived and equity recovery will be back on track. Furthermore, as long as inflation continues to ease, US corporate earnings will likely dig out of their recession to begin a cyclical recovery in the second half. Driving the market higher would be from a broader range of index constituents.
Fixed Income
Fitch’s downgrade of the US sovereign rating from AAA to AA+ on Tuesday evening (sandwiched between the release of Treasury’s quarterly financing estimates on Monday and its quarterly refunding announcement on Wednesday) reinforced media attention on the series of increases in coupon issuance and the accordant rise in duration supply that will be hitting markets over the coming months. Broad curve twisted steeper by 29bp. However, domestic data were supportive of lower front-end yields: nonfarm payrolls increased 187k in July (consensus: 200k). The unemployment rate also ticked down to 3.5% (consensus: 3.6%), while average hourly earnings rose 0.4% (consensus: 0.3%).
While the focus on rising Treasury issuance may have been the proximate cause of this week’s selloff, we do not think that supply considerations nor the Fitch rating downgrade warrant such a move, and we instead think the bear steepening was exacerbated by technical factors. The sharp decline in yields on Friday in the wake of a near-consensus payrolls print supports the notion that positions are cleaner and investors were perhaps waiting to get through the employment data before adding to duration.
Turning to corporates, high grade credit spreads widened 3bp to 136bp on the JULI index, after briefly reaching a new YTD low of 130bp at month end. Following the BoJ YCC band widening, many investors are wondering if the higher-yielding sovereign debt would reduce the appeal of US HG debt for Japanese investors, or even prompt outright selling.
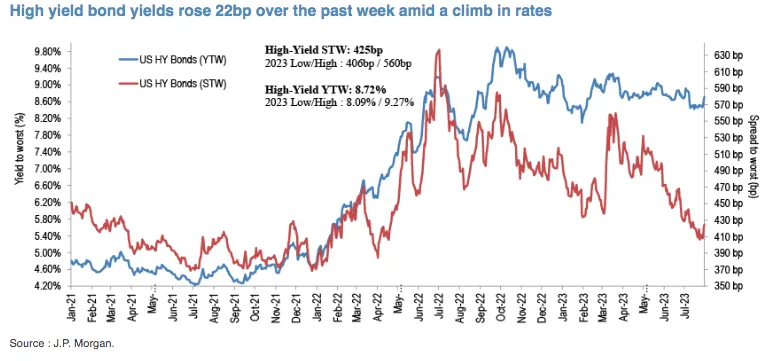
High yield bond yields and spreads increased 22bp and 19bp over the past week to 8.72% and 425bp. Despite June and July’s rallies, we believe the HY bond will be supported over the balance of 2023 by a resilient labour market, strong corporate balance sheets, positive technicals, and steadily improving capital market access.
Figure 8: High Yield Yields Rose
