
The global equities market surged by 2.73% this week on the back of the US Fed pausing its interest rate hike cycle, the Chinese government cutting its OMO and MLF to boost the slower-than-expected economic recovery, and slowing inflations. Driving the surge in global equities were Europe (MXEU) and emerging markets (MXEF) which rose by 3.31% and 2.93% respectively. The US equity market (MXUS) increased at a slower pace (+2.67%) while the China market rebounded by a strong 4.81%. The global fixed income index, which underperformed equities, rose by a mere 0.36%.
Figure 1: Major Indices Performance
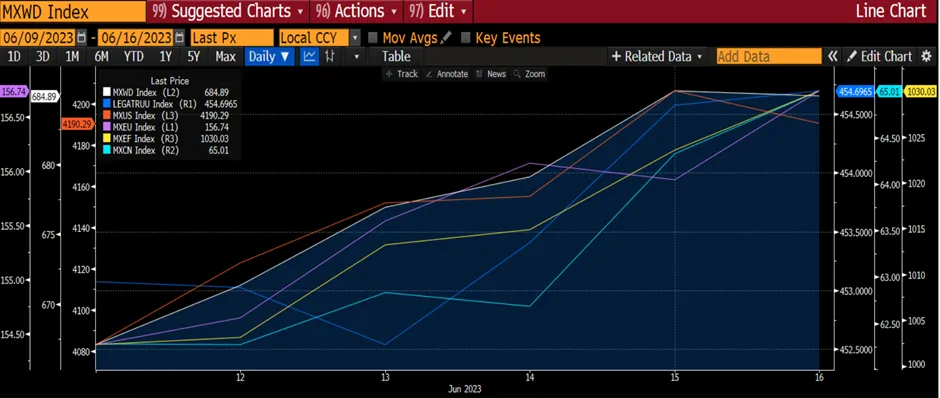 Source: Bloomberg
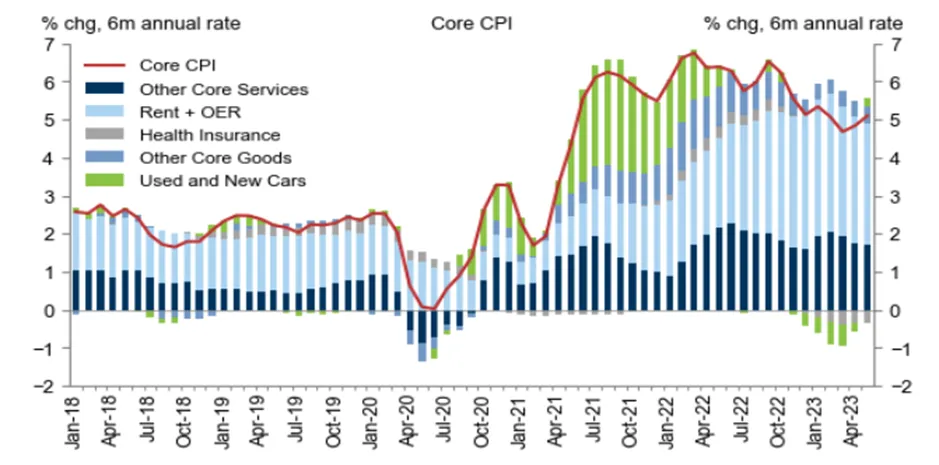
On 13 June, the US’s May core CPI rose 0.44% (MoM), 4bps above consensus and 2bps above the prior three-month average. The composition of the report was more encouraging, as used cars contributed +0.15pp to the core and falling auction prices argue for declines by July. More importantly, the March/April slowdown in shelter categories was sustained in May—rent +0.49% and OER +0.52%, compared to the winter monthly trend of 0.7-0.8%— consistent with slowing growth in new rental pricing and a waning boost from expiring rent concessions that landlords offered during the pandemic. Inflation breadth softened further in May. Headline CPI rose 0.12%, as energy prices fell 3.6% but food prices rose 0.2%. Overall, these numbers were supportive of a pause in the interest rate hike cycle. The probability of a rate hike fell to about 20% after the release of these CPI numbers.
Figure 2: Core CPI Rose
 Source: Department of Labour
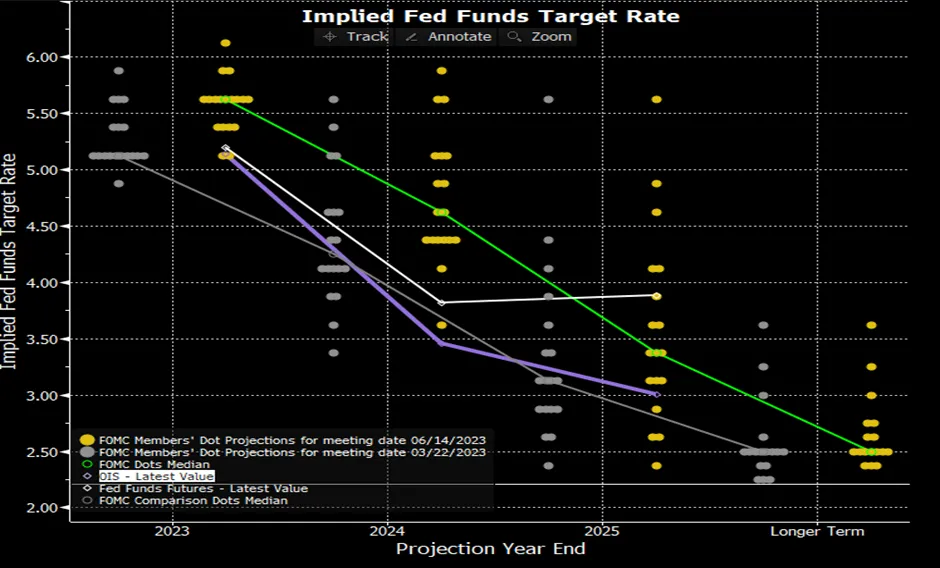
On 14 June, the FOMC announced that it had left the target range for the federal fund rate unchanged at 5-5.25%. This was widely expected. The median dot in the Summary of Economic Projection however, showed a funds rate of 5.625% at the end of 2023, a 50bps increase from the March projections, suggesting that there would be two more rate hikes before the end of the year. Furthermore, for 2023, the report showed higher GDP growth (+0.6pp to +1.0%), a lower unemployment rate (-0.4pp to 4.1%), and higher core inflation (+0.3pp to +3.9%). The median forecast showed slightly lower GDP growth in 2024 (-0.1pp to +1.1%) and 2025 (-0.1pp to +1.8%). The median unemployment rate projection was lowered slightly for both 2024 and 2025 (-0.1pp to 4.5% for both). The median core inflation forecast was revised up for 2023 (+0.3pp to 3.9%) and 2025 (+0.1pp to 2.2%) but was unchanged in 2024 at 2.6%.
“We have raised our policy interest rate by five percentage points, and we’ve continued to reduce our security holdings at a brisk pace. We’ve covered a lot of ground and the full effects of our tightening have yet to be felt,” said Fed Chair Jerome Powell. “Holding the target range steady at this meeting allows the Committee to assess additional information and its implications for monetary policy.” The FOMC has yet to decide whether an increase in rate would be likely in July. The Fed will hold another 4 meetings before the end of the year. Nearly all Fed officials expect it will be appropriate to raise interest rates “somewhat further” in 2023 to bring down inflation.
Figure 3: The Fed’s New Dot Plot
 Source: Federal Reserve FOMC
There were minimal changes made to the post-meeting statements characterizing the current state of the economy. The statement reiterated that, while the “banking system is sound and resilient,” tighter credit conditions “are likely to weigh on economic activity, hiring, and inflation, “though the extent of these effects “remains uncertain”.
Figure 4: Recession Risk Receding
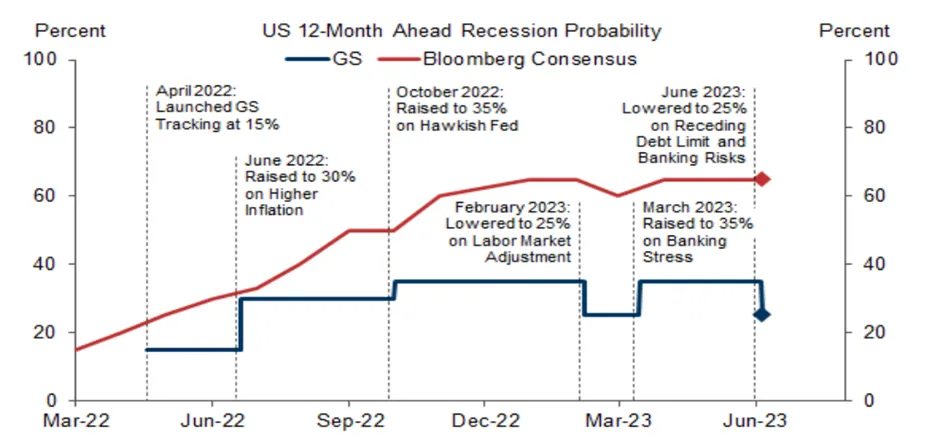 Source: Bloomberg, Goldman Sachs Global Investment Research
According to Bloomberg Intelligence, a pause in Fed’s rate hikes may be enough to allow a sigh of relief for equities. There have been six distinct instances since 1970 when the Fed raised rates by over 100bps for a period of a year or more, then took a breather on hikes for at least three months. In all instances, this was accompanied by a recovery in equities. The S&P 500 returned an average of 8.2% in those periods, well above the longer-term three-month average gain of 2.1%. During the entirety of the rate hike pause, stocks averaged a return of 1.4% a month, above the overall of 0.9%. However, there was one exception to the rule. From May to December 2000, stocks fell during a rate hike pause during the bursting of the tech bubble.
Figure 5: S&P 500 Returns After Pause
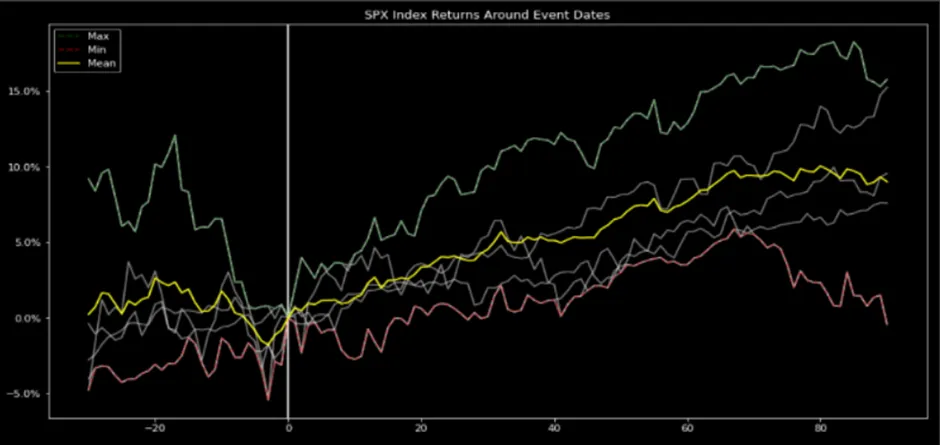 Source: Bloomberg
We fear that stocks focused on the potential for near-term policy reversal may be missing the big picture. The Fed Funds rate is unlikely to reach its former lows if there's a recession, limiting stock-price returns. In each recession cycle since the early 1980s, the Fed has reduced rates to new lows and easy policy effectively became a feature of economic recovery. But current inflation risks imply that the likelihood of a full circle from the Fed is low. Rates reversals to higher lows were normal in the 1960s and 1970s, but so were slower average annual returns for stocks and lower P/Es. The average annual return for equities over the past 20 years was 9.1%, but in the 1960s and 1970s, it was 4.2%. Likewise, the equity-market multiple averaged 24.7x over the past 20 years and just 15.1x in the two decades that ended in 1980.
Figure 6: CPI vs S&P 500
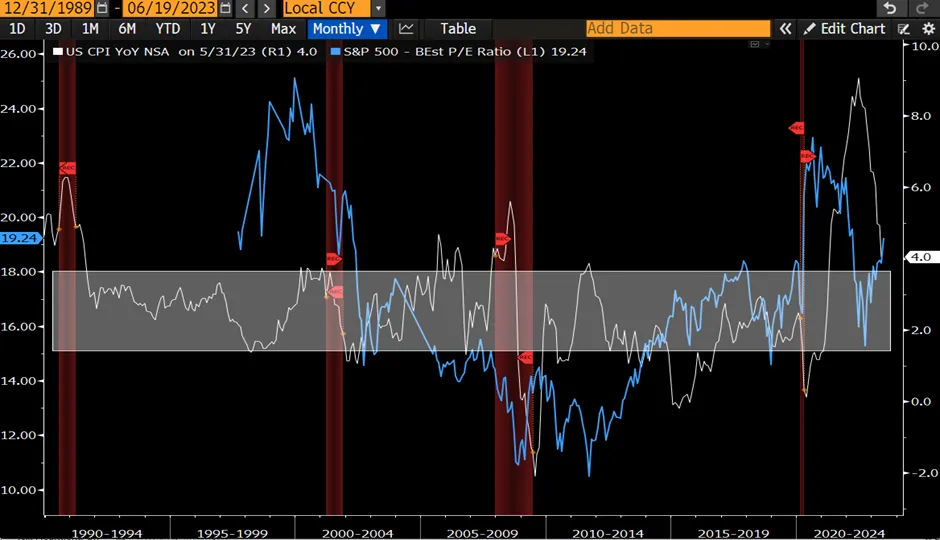 Source: Bloomberg
Other key data that was released during the week was industrial production, which declined by 0.2% in May, below consensus expectations for a small increase. Manufacturing production increased 0.1%, above consensus expectations. The level of industrial production was unrevised in April, while manufacturing production growth was revised down 0.1pps to +0.9%. The capex-sensitive business equipment category edged down by 0.1%. Capacity utilization decreased 0.2pps to 79.6% from an upwardly revised level in April (+0.1pps to 79.8%).
While the US decided to hold its interest rate, the ECB raised its interest rate by 25bps. The ECB also confirmed that they will stop reinvesting bonds under the Asset Purchase Programs. Both decisions were widely expected. In the press conference, Christine Lagarde said the ECB “will likely raise rates again in July, and it hasn’t begun thinking about pausing.” That came about as the inflation outlook was raised for the headline and underlying rate. Policymakers now see inflation slowing to only 2.2% in 2025, which Lagarde said wasn’t satisfactory. She also said the meeting was “harmonious” and that officials spent a long time discussing the labour market, which remains resilient to weak economic activity and is a growing concern behind inflation dynamics.
Christine Lagarde said the outlook for economic growth and inflation in the euro area remains highly uncertain”. “Downside risks to growth include Russia’s unjustified war against Ukraine and an increase in broader geopolitical tensions, which could fragment global trade and thus weigh on the euro area economy”. “Growth could also be slower if the effects of monetary policy are more forceful than projected”. “Renewed financial market tensions could lead to even tighter financing conditions than anticipated and weaken confidence”. Also, weaker growth in the world economy could further dampen economic activity. However, growth could be higher if the strong labour market and receding uncertainty mean that people and businesses become more confident and spend more. We are therefore expecting at least another hike in July, and another 25bp in Sept, taking the terminal rate to 4.0%. While macro growth data have been soft, the momentum in services activity and the labour market has remained firm. In fact, earnings revisions have been strongest globally. But this is not rewarded in stock valuations.
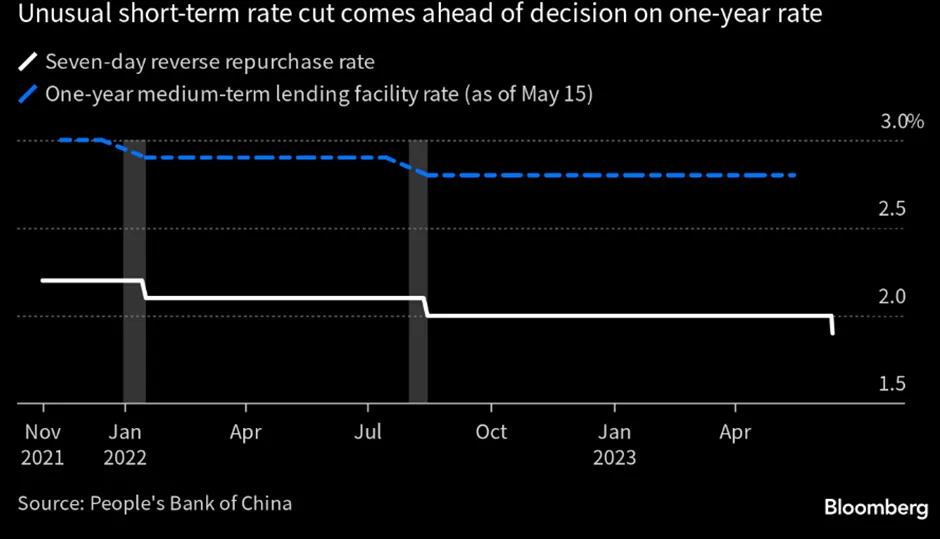
While the developed markets either paused their rate hike or continued to hike, the PBOC was cutting rates. At the beginning of the week, the PBOC had asked the banks to lower their deposit rates for the second time in less than a year, which would give the PBOC some room to reduce lending rates and reduce incentives to save. This was followed by a 10bps cut to 1.9% in the OMO (open market operations) 7-day reverse repo rate (a process in which the central bank purchases securities from commercial banks through bidding, with an agreement to sell them back in the future) which adds liquidity to the market and suggests the start of additional monetary policy easing to come.
Figure 7: PBOC Rate Easing
Most China’s May activity data were weaker than expected thus suggesting sequential growth momentum weakened meaningfully in 2Q vs 1Q. Industrial production growth slowed in May from April in YoY terms, led mainly by weaker growth in automobiles and general equipment output. Retail sales and the Services Industry Output Index both declined in YoY terms in May from April, as base effects became less favourable. Fixed asset investment growth also fell in May from April, dragged by weaker property and services-related investment growth. Property-related activity growth weakened meaningfully in May despite still-favorable base effects and continued housing easing, especially for new home sales and completions. Despite stable nationwide unemployment rates, the youth unemployment rate rose further on seasonal factors and is expected to edge higher in the coming months amid the graduation season. Looking ahead, base effects will turn unfavorable in June-July (as Shanghai came out of lockdowns last June) and weigh on YoY growth in economic activity, while it may take time for recent and future policy easing measures to kick in.
We, therefore, remain cautious and selective for China.
Figure 8: Slowing Activity
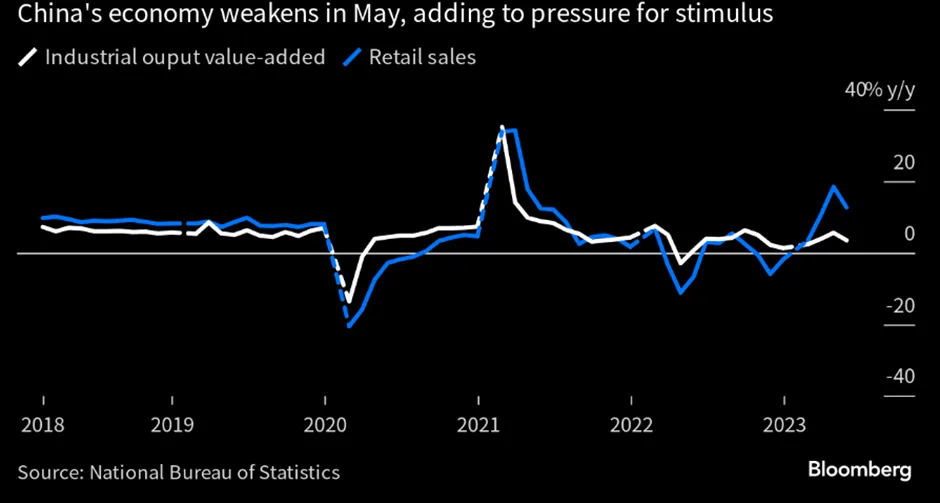
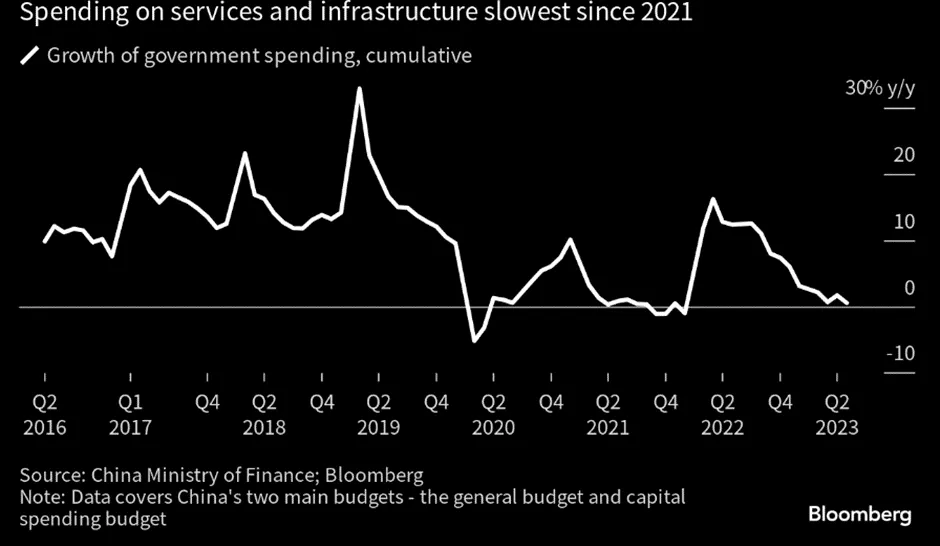
Figure 9: China’s Fiscal Support Has Been Weak