

The global equity market continued to rise on the back of the successful negotiations and approval to raise the US debt ceiling, US officials had “candid and productive” discussions with Chinese officials on the bilateral relationship, and the expectation of further aid for China by the Chinese government after the release of disappointing economic data. Furthermore, investors are betting on a pause in the rate hike in the next meeting on 14 June 23. For the week, the global equities index rose 0.61% and it outperformed the global fixed income index, which was flat for the week. Most major indices increased during the week, led by MXCN (+1.77%) while MXUS increased at a slower pace of 0.38% and 0.41% respectively. MXEU, however, declined slightly (-0.12%).
Figure 1: Key Indices Performances
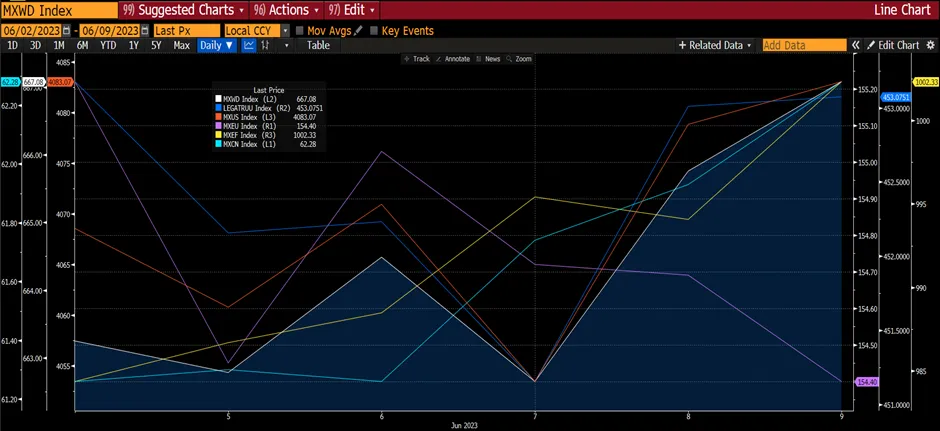 Source: Bloomberg
Despite poor export numbers, the Chinese market rebounded from the previous week’s decline led by financial shares as regulators vowed to push for more open markets and Chinese authorities asked the big banks to have another round of deposit rate cuts.
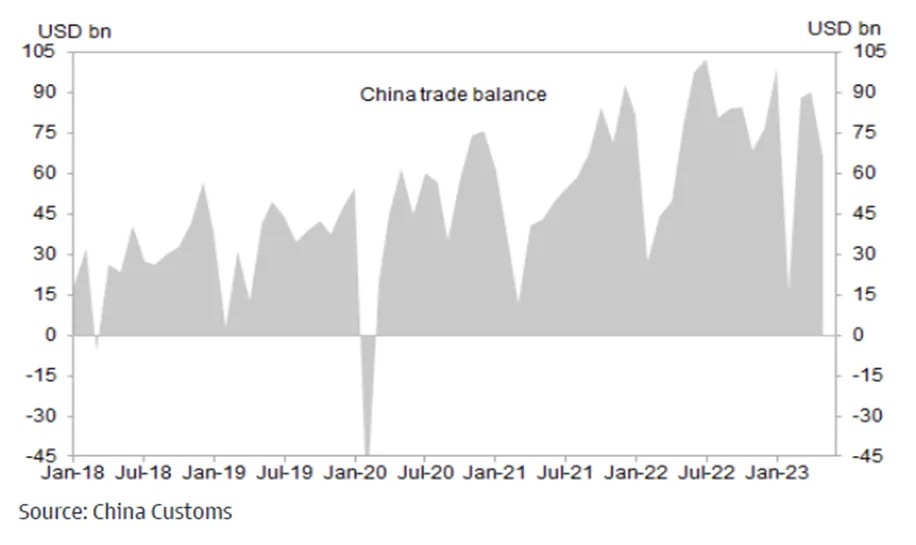
China’s economic recovery showed further signs of weakening in May, derailing expectations of China’s reopening theme. Exports declined sharply in May on year-over-year and sequential terms, significantly below the consensus forecast. In year-over-year terms, China's exports declined -7.5% YoY vs. Bloomberg consensus of -1.8% YoY, and imports fell 4.5% YoY in May vs. -7.9% in April. In sequential terms, exports declined by 10.9% in May (vs. -5.4% in April) and imports decreased by 0.1% in May (vs. -5.1% in April). As a result, China's trade surplus fell to US$65.8bn in May (not seasonally adjusted) from US$90.2b in April. Export value declined sharply across major trading partners and products on weaker external demand. The import value of commodities (such as soybean and crude oil) rose sharply in sequential terms primarily on increasing volumes.
Figure 2: China’s Exports In May Declined
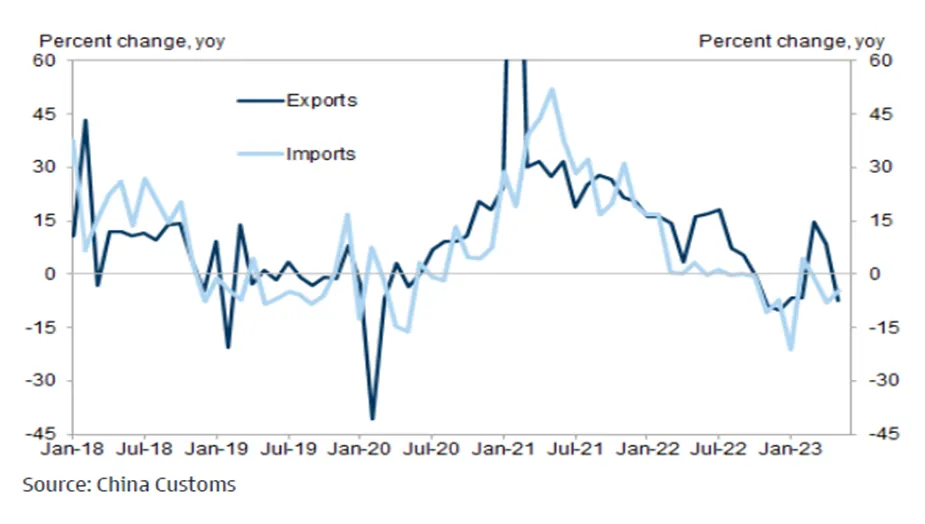
Figure 3: China’s Trade Surplus Declined In May But Remains Healthy
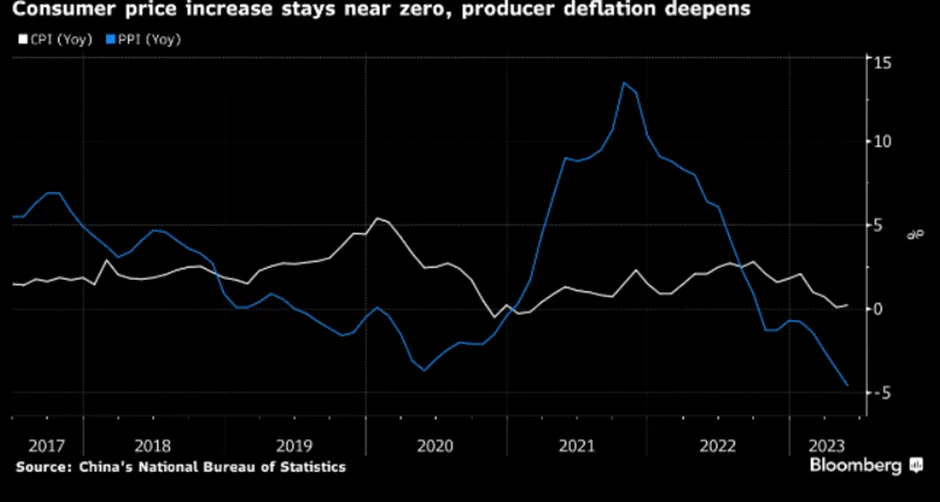
China’s inflation remained close to zero in May, giving the central bank scope to ease monetary policy as calls grow louder for more interest rate cuts to spur the economy’s recovery. According to the National Bureau of Statistics, the consumer price index rose 0.2% from a year earlier, in line with forecasts, and up from 0.1% in April. Producer prices declined by 4.6% on the back of lower commodity prices and weak domestic and foreign demand. Economists had expected a 4.3% decrease.
Figure 4: China’s Inflation Remains Subdued
The inflation data has provided fresh evidence that China’s economy cooled further in May, coming on the back of recent reports showing manufacturing activity contracted, exports shrank for the first time in 3 months, and a rebound in the housing market has faded. Economists believe China’s central bank would cut its RRR and aside from a RRR move, some expect an interest rate cut could come as early as next week. A rate cut would further widen the gap between interest rates in China and the US, where the Fed has been tightening policy to curb inflation. Lower interest rates in China compared to the US have fueled capital outflows and weighed on the RMB, which is down 3.1% against the greenback this year. Expectations are rising that the Fed will likely keep interest rates higher for longer. Meanwhile, the US market continues to trend higher, and strategists are beginning to get wary of valuations and earnings growth. Furthermore, concerns about a potential economic recession dominate market sentiment, but the S&P 500's earnings recession is already showing signs of ending. S&P 500 net income margins, excluding the energy sector, have been contracting since 2021, but the 1Q23 reporting season showed the first signs of improvement. The consensus believes the margin compression that plagued the index in 2022 is in the past.
Figure 5: Net Income Margins Ex Energy Seen To Be Improving
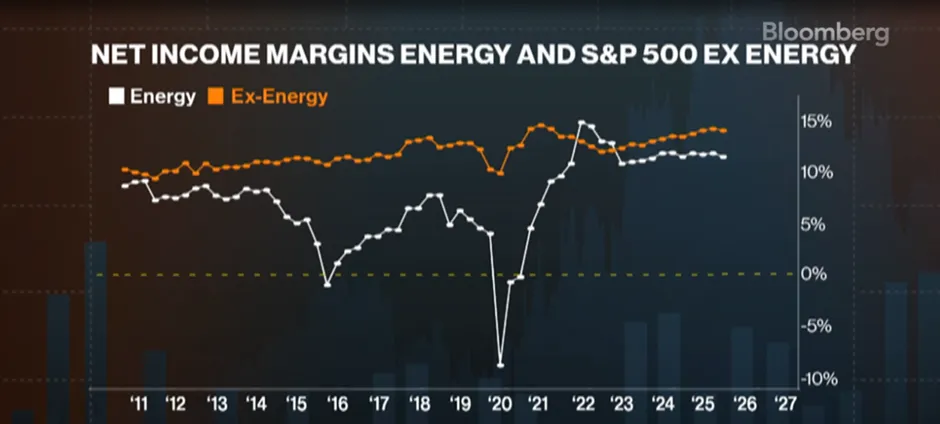
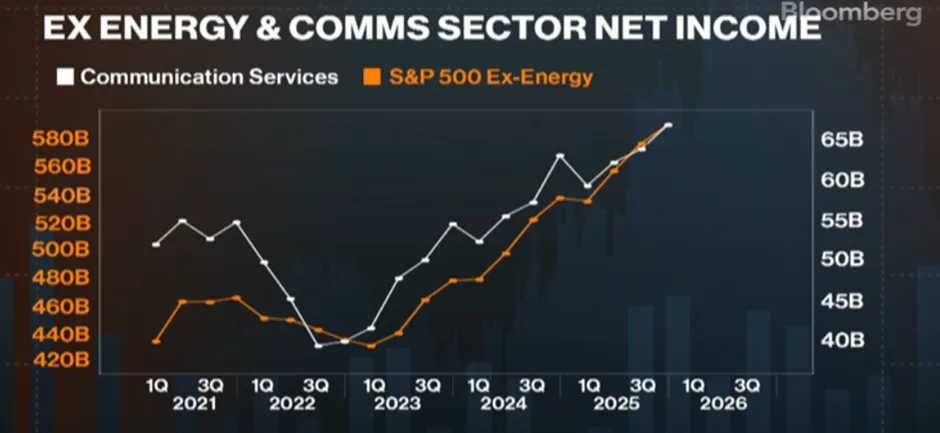
The S&P 500 margins, ex-energy, have been crunching since mid-2021. However, in the first quarter earnings season, we saw the first signs of potential improvement in the margin. And if consensus is correct, that margin compression that really plagued the index throughout 2022 is likely to end this year as margin forecasts imply improvement for the rest of the year. Certain sectors are also showing signs of recovery. Communications services within the S&P 500 suffered a tremendous earnings downdraft in 2022. Net income for the sector was down by nearly 25% over the course of last year. However, with the first quarter earnings season, this space showed a second consecutive quarter of sequential healing in earnings trends. If the consensus is correct, the sector’s earnings growth improvement should lead to the index improvement throughout the rest of 2023.
Figure 6: Net Income Should Improve Going Forward
 Source: Bloomberg
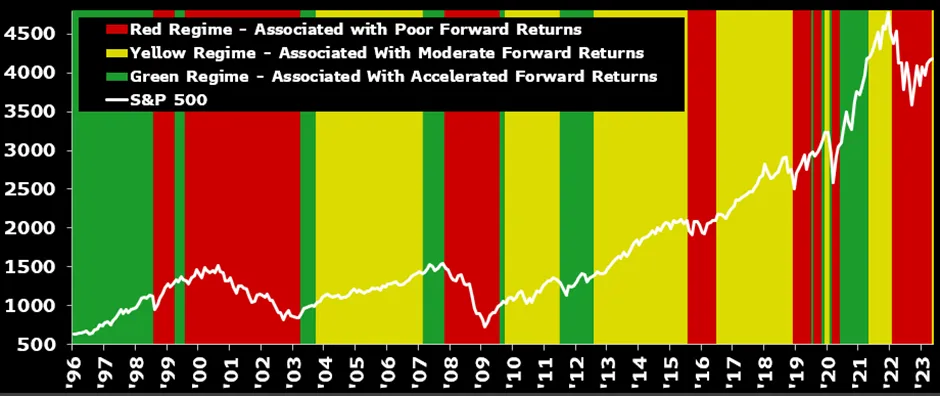
According to Bloomberg’s strategists, their market regime model has shifted out of the cautious zone that has been stuck in it for 15 months, signaling a brighter future for US equities has emerged. Five of its six signals, except for corporate bond spreads, support a better environment for equities. Forward returns for equities have been historically more positive when their model indicates a yellow regime versus a red one, but they haven't been as strong as during a green regime, suggesting return expectations should hover around the average under current conditions. Six- and 12-month average returns when the model lies in the red regime are minus 0.04% and 1.45%, respectively, compared with yellow's 4.3% and 8.6% and green's 9.4% and 17.1%. Forward S&P 500 six- and 12-month returns after first entering a yellow regime are slightly better than the average of 6.2-11%, though still not quite as good as the returns associated with green regimes.
Figure 7: Better Times Ahead For US Equities
 Source: Bloomberg Intelligence
Figure 8: PMI Still Healthy
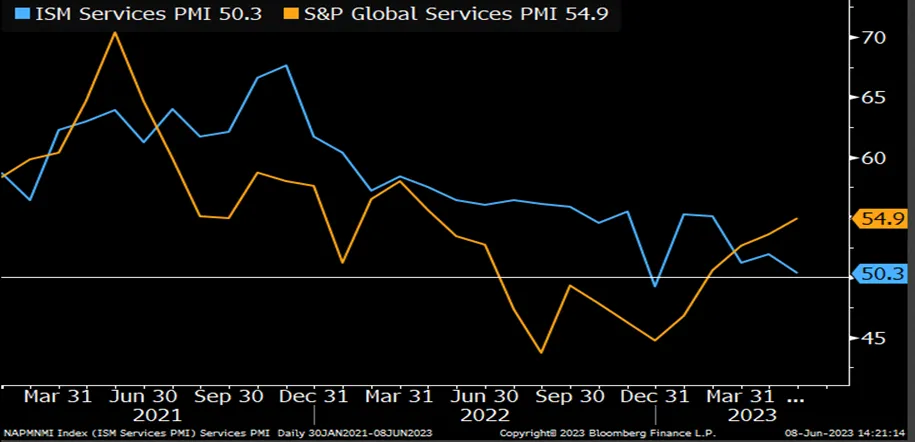
As Bloomberg is positive on US equities, there is a large divergence between the ISM and S&P Global Services PMIs present a confusing economic picture on a monthly basis; but perhaps more meaningful for stocks as price indexes for both eased and longer-term headline trends are flat to higher. High inflation caused distress in US earnings last year, and this year's cooling is enabling margin stability for the first time since late 2021, just as services PMI suggests the demand outlook at least isn't worsening.
Bloomberg’s economist Eliza Winger suggests the ISM index (headline 50.3) likely overstated the degree of slowdown; it would have been 51.2 if supplier deliveries were excluded, given continued improvements in delivery times and capacity. But she's also skeptical of the strong upturn in the S&P's measure, given the softer trend in spending on services.
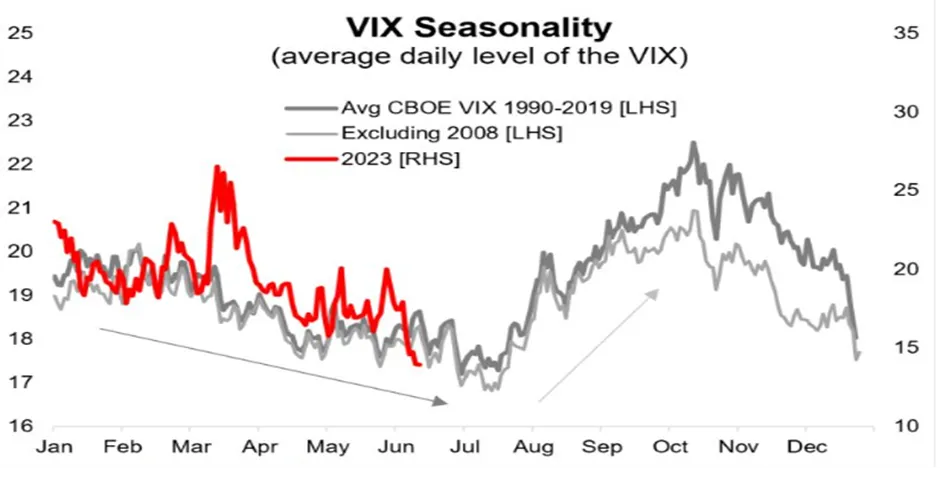
Also, interestingly note that according to Topdown Charts, VIX is reaching multi-year lows on improved growth optimism. The VIX has been trending pretty much in line with its seasonal trend (the historical tendency is for the VIX to trend lower in the first half of the year, and then push higher into 3Q). This mirrors the tendency of stocks to stumble around the Aug-Oct period. But for now, markets are likely to continue to trend higher.
Figure 9: VIX Seasonality
 Source: Top Down Charts, Refinitiv