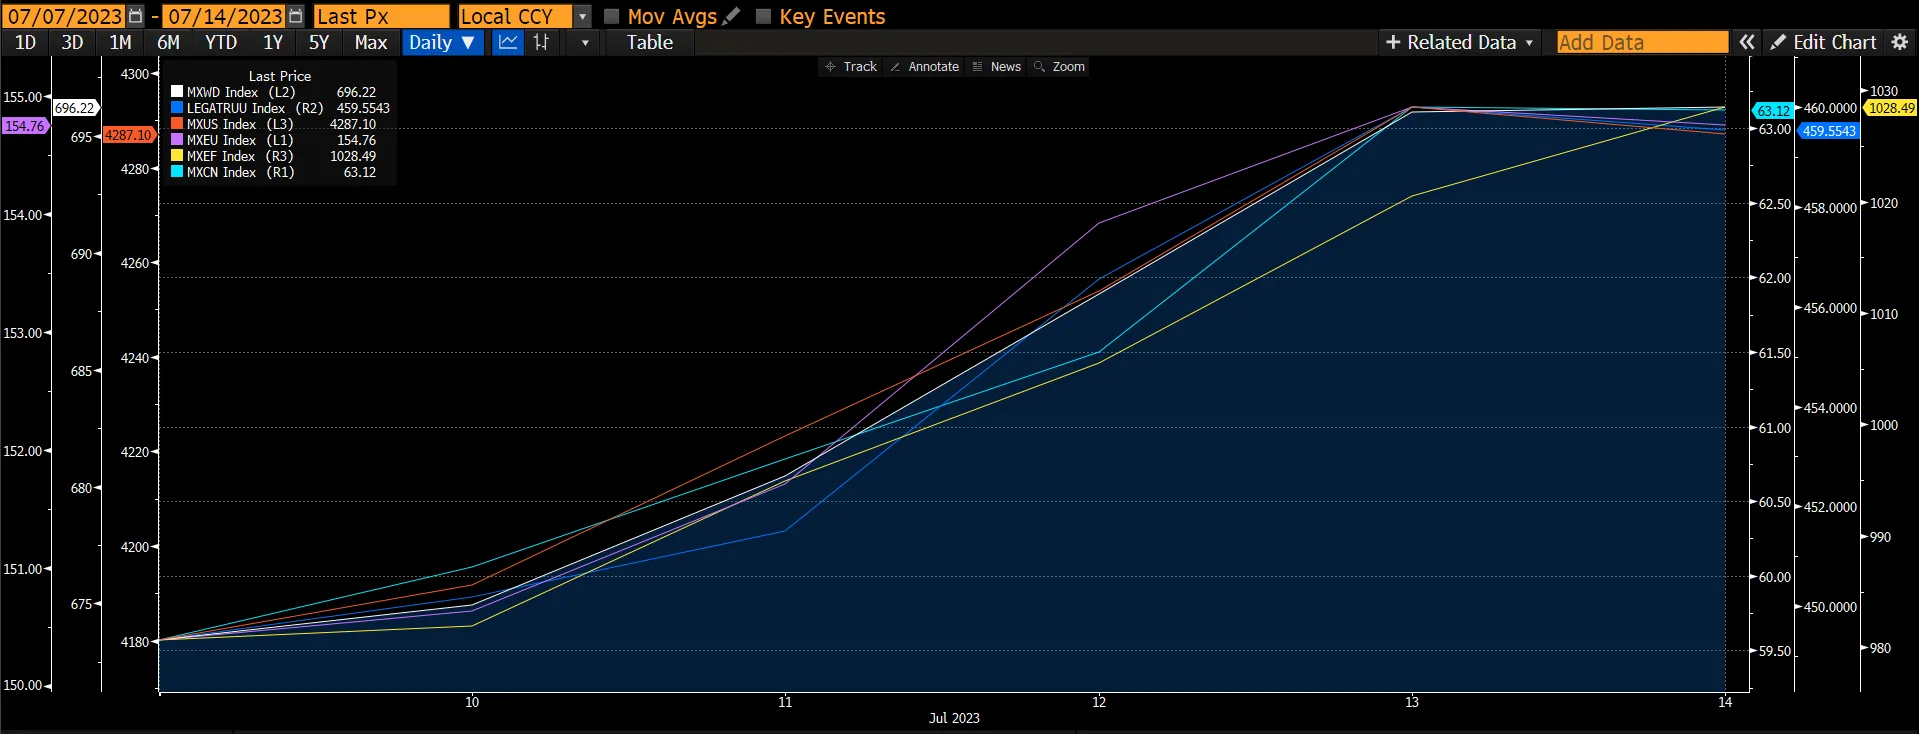
The global equity market continues to rally on the back of a softening labour market, and lower CPI for June while the Chinese market rebounded strongly on improving policy-easing expectations despite poor economic data. The global equity market (MXWD) rallied 3.41% on the back of a 5.44% surge in the European market (MXEU) and a 6.28% rise in the Chinese market (MXCN). The US market (MXUS) rose by 2.58%. The equity market continues to outperform the fixed income market which rose 2.28%.
Figure 1: Major Indices Performance
 Source: Bloomberg
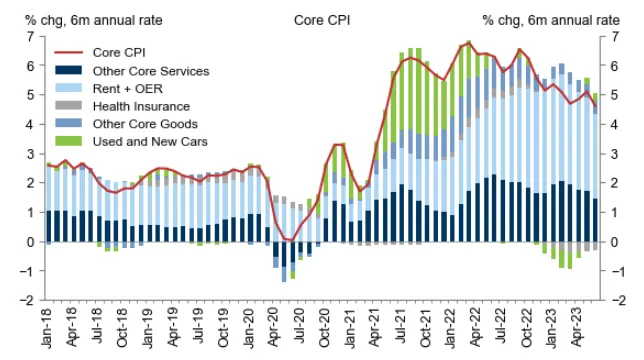
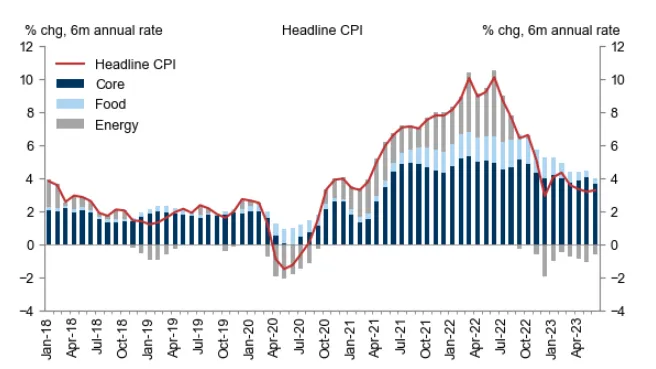
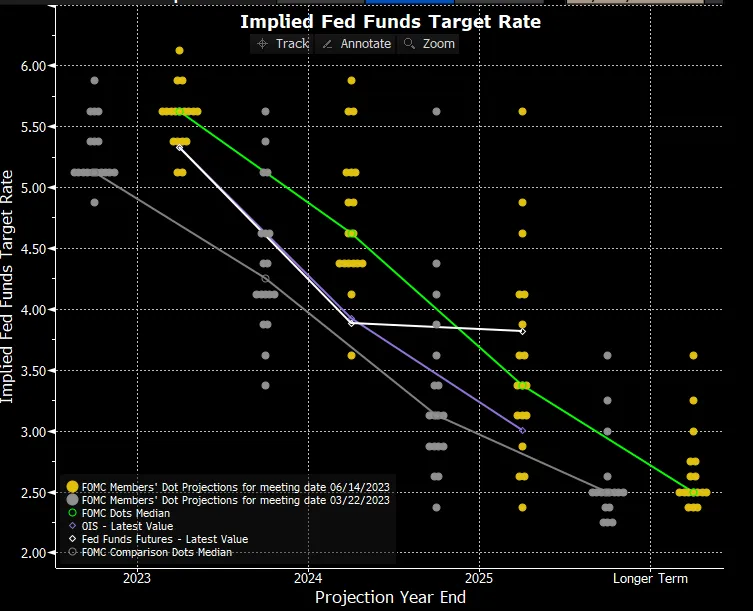
US June core CPI rose by 0.16%, its smallest increase since February 2021, and the year-on-year rate fell five-tenths to 4.8%, both below consensus. While a sharp decline in airfares lowered the core reading by 6bps, shelter categories slowed modestly further, and an estimated 0.5% drop in used car prices is the beginning of a larger pullback. Today’s report is consistent with the view that Fed tightening is in its final phase. The market is now pricing in a 92% chance of a 25bps rate hike in the July FOMC meeting to 5.25-5.5%. This could be the last hike for the year, instead of the two hikes previously guided by the dot plot. Headline CPI rose 0.18%, as energy prices rose 0.6% and food prices edged up 0.1%.
Figure 2: Core CPI
 Source: Department Of Labour
Figure 3: Headline CPI
 Source: Department Of Labour
Figure 4: FOMC Dot Plot
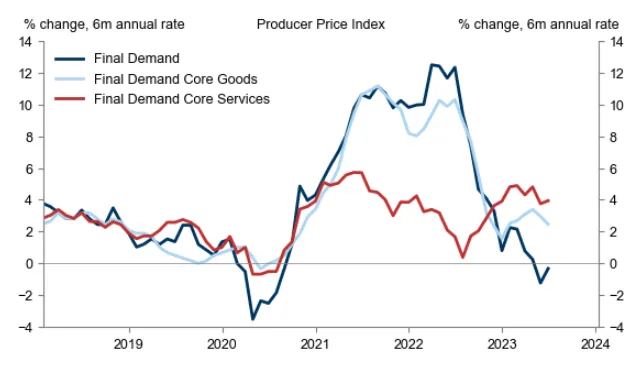
The US producer price index (PPI) increased by 0.1% in June, one-tenth below consensus expectations. Core measures were also below consensus expectations, as the PPI excluding food and energy increased by 0.1%, and the PPI excluding food, energy, and trade services increased by 0.1%.
Figure 5: PPI
 Source: Department Of Labour
Initial jobless claims fell by 12k to 237k, against consensus expectations for a slight increase. While initial claims still appear to be boosted by non-economic factors, the sequential decline likely overstates any potential strengthening in the labour market due to a favourable seasonal comparison.
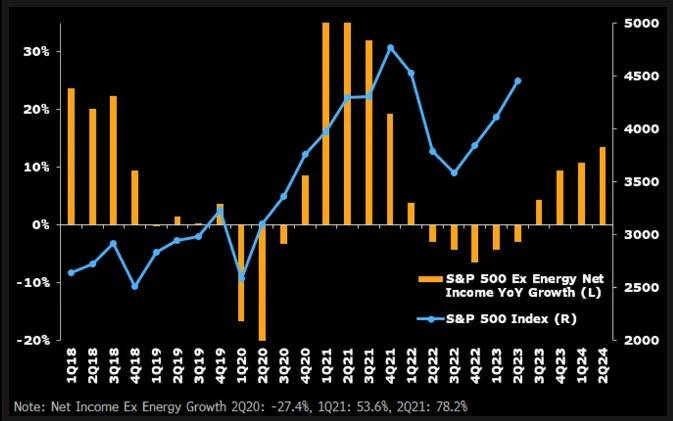
Economists continue to call for a US recession to emerge later this year, but stock prices have been rising nonetheless, leading many observers to conclude that equity markets are doomed to fail. Why the disconnect? We believe the equity markets trade on corporate earnings trends, rather than economic projections, and understanding the drivers of divergences between the two is a key consideration for a successful market strategy. Earnings have cued the price recovery this year.
Excluding the energy sector, stocks are following earnings moves closely. Energy - a primary input cost for the rest of the S&P 500 - often zigs when the rest of the index zags, creating a distorted view of underlying earnings trends. The equity gauge, currently with a very small energy component, simply follows a path indicated by profit growth outside of the energy sector. Excluding that industry, net income growth in the index peaked in the middle of 2021 and subsequently recessed in 2022, proving predictive of the S&P 500 price trend. The headwind appears to have turned into a tailwind by the end of 2022, as earnings outside of energy have suffered incrementally lighter year-over-year declines in 2023. Consensus sees those decreases being followed by growth in 2024. Thus, we believe this would be one of the drivers for the equity rally to continue as investors shift their focus and begin looking at 2024 earnings growth.
Figure 6: S&P500 vs Net Income ex Energy YoY Growth
 Source: Bloomberg
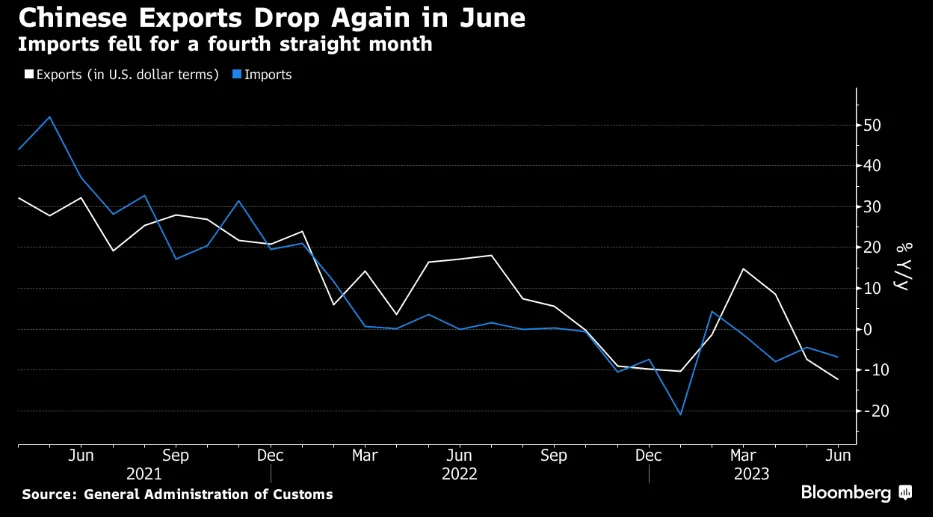
Several important data were released this week in China that continued to disappoint. Both inflation and trade data disappointed market expectations. Headline CPI inflation fell to 0% YoY (vs. 0.2% Bloomberg consensus) and PPI inflation dropped to -5.4% YoY (vs. -5.0% Bloomberg consensus). Exports declined 12.4% YoY (vs. -10% Bloomberg consensus) and imports decreased 6.8% YoY (vs. -4.1% Bloomberg consensus). In addition, the NBS 70-city average property prices fell 2.2% MoM annualized in June, a larger decline than in May. The latest batch of data showed soft demand both domestically and externally and suggests more policy support is needed.
Deputy Governor of PBOC, Liu Guoqiang commented that CPI inflation might drift lower in July, mainly on delayed demand recovery and base effect. However, "China has not experienced deflation and will not see deflation in 2H either", according to Liu. He expected CPI inflation to increase from August and to approach 1% towards year-end.
Figure 7: Decline In Exports
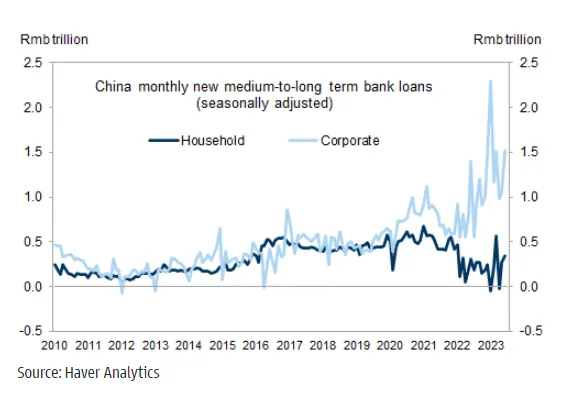
June total social financing (TSF) data, however, beat market expectations. TSF new flows were RMB4.2t, compared to Bloomberg consensus of RMB3.0t. Most of the strength came from bank loans, in particular medium-to-long-term corporate loans. Combined with the sharp decline in fiscal deposits, it suggests policy push was behind the stronger-than-expected credit data. During a press conference, senior PBOC officials hinted at further easing of property policies, including allowing for interest rate reductions for outstanding mortgages, and monetary policy loosening via liquidity tools. This suggests the possibility of the much wanted and probably needed 25bps RRR cut in 3Q23.
Figure 8: Medium-To-Long Term Bank Loans
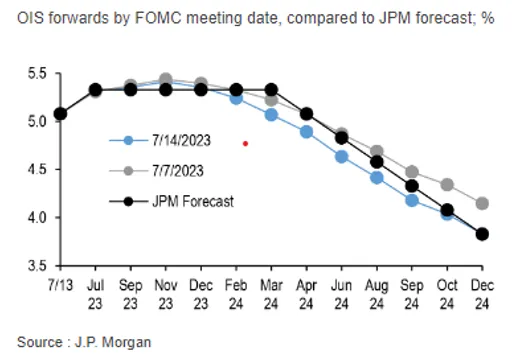
US Treasury prices jumped as longer-term yields retreated on the positive inflation data, with the yield on the benchmark 10-year note falling below 4%. Over the week, the 10-year Treasury yield decreased -24 basis points (bp), down to 3.83% from 4.07%. The 2-year Treasury yield decreased -18bp, down from 4.95% to 4.77%. Markets are now expecting that the Fed would like to be more aggressive in terms of interest rate cuts.
Figure 9: Market Pricing In A More Dovish Fed Path After Soft CPI
European government bond yields fell as slowing US inflation raised expectations that the Fed is nearing the end of its policy tightening cycle. The yield on the benchmark 10-year German government bund decreased -12bp over the week from 2.63% to 2.51%.
UK bond yields also declined, but robust wage data appeared to cushion the drop. Over the week, the UK 10-year gilt yield decreased -21bp, from 4.65% to 4.44%.
Growing expectations that the BoJ could adjust its yield curve control framework as early as its 27-28 July meeting exerted upward pressure on domestic yields. The yield on the 10-year Japanese government bond rose to 0.47%, from a prior 0.42%, nearing the 0.50% level at which the BoJ caps JGB yields.
The credit market had a strong week, mirroring the positive performance of equities. Investment grade bonds outperformed US Treasuries bonds (+1.5%) and US high yields (+1.7%), posting a gain of over 2% for the week. US high yield spreads tightened by more than 10bps, remaining below 400bps since the beginning of July. In Europe, both investment grade and high yield segments also saw gains, with increases of +0.8% and +0.6% respectively.
EM hard currency corporate bonds saw a gain of over 1% for the week, although they underperformed US Treasuries due to a widening of EM corporate spreads by more than 10bps. On the other hand, EM local currency bonds experienced a strong performance, rising over 2% for the week, benefiting from the significant depreciation of the US Dollar.
For fixed income, we recommend overweighting short-dated bonds. We remain defensive in our credit positioning and thus prefer high-quality credit. We expect credit spreads will leak wider to account for slowing growth and recession risks.

