

Global markets declined on the back of rising geopolitical risk, concerns over the US debt ceiling, and Chinese data coming out weaker than expected despite better-than-expected corporate results in the US and Europe. Global equity markets fell by 0.4% while the Global fixed income index declined by 0.46%. MXUS was relatively flat (falling by just 0.17%) while MXEU dropped by 1.32%. Emerging Markets declined by 0.86% as the China market plummeted by 2.24%.
Figure 1: Major Indices Performance
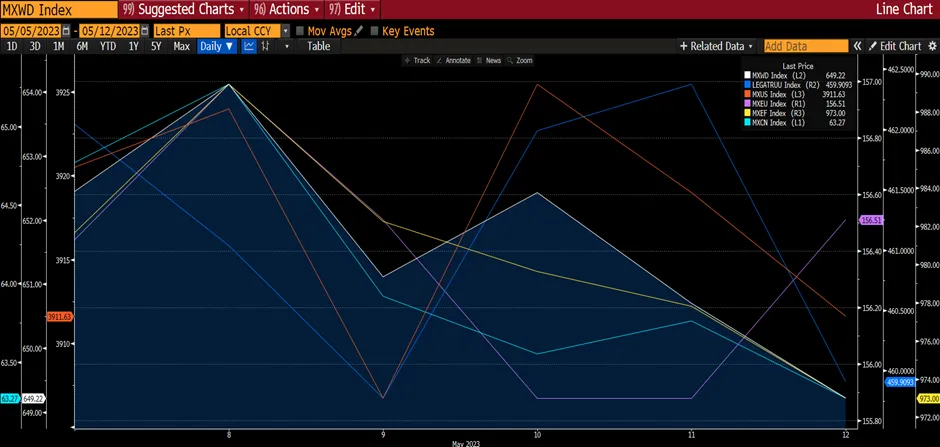 Source:Bloomberg
The 1Q23 earnings season for the US corporates proved to be much better than feared. S&P 500 companies’ profits fell by 3% YoY, compared with consensus estimates of a 7% decline at the start of the reporting season. Revenues grew by 4%, above expectations for 2% growth. Net margins contracted by 99 bp, the third consecutive quarter of YoY margin decline, but by less than the 146 bp expected. Margins in every sector surprised on the upside, led by Materials and Info Tech. The aggregate S&P 500 EPS surprise of 5% was in line with the historical median after being below average for most of 2022. Financials EPS grew by +5% YoY. This news, in our opinion, should provide the catalyst for the markets to move higher. On a sectoral basis, the technology sector has one of the highest percentages of companies that reported positive earnings surprises this quarter, at 84%. Furthermore, Big Tech on aggregate has also outperformed the S&P 500 by c.33% on a YTD basis. As the Fed continues to keep monetary policy tight and the cost of capital remains elevated, we believe that Big Tech, through their market leadership, brand equity, economies of scale, and high cash balance will be able to better navigate this landscape. Furthermore, as the input price starts to decline, we believe margins will be better off.
Figure 2: 1Q23 S&P 500 EPS, Sales and Margin Results
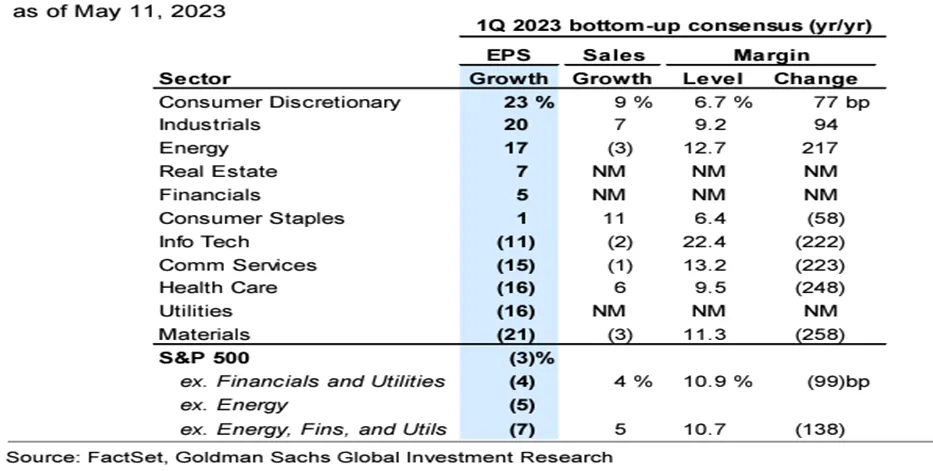
Figure 3: Largest Earnings Surprise Came From Tech Sector
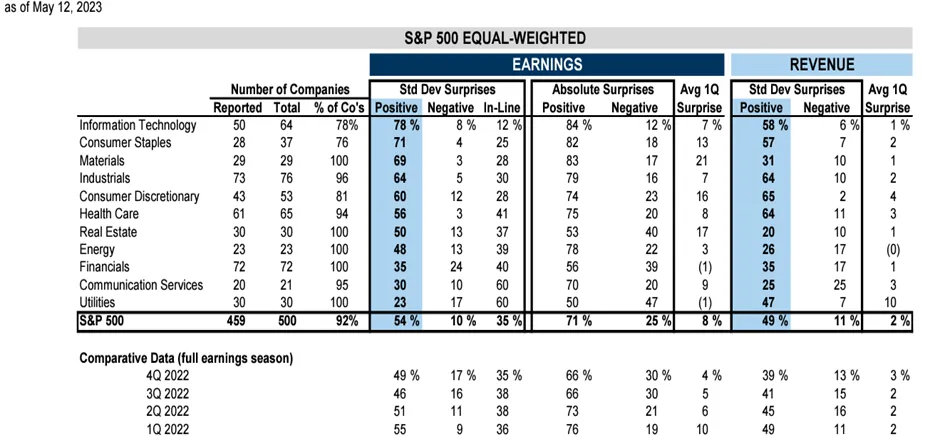 Source: Compustat, FirstCall, Bloomberg, IBES
Meanwhile, Mega-cap tech has outperformed the S&P 500 by 32pp in 2023 and accounted for most of the cap-weighted index’s 6% YTD return. The returns of large tech stocks (AAPL, AMZN, GOOGL, META, MSFT) have ranged from 29% to 94%. In aggregate, their 44% YTD return has come on the heels of a 38% decline in 2022. We are surprised by the strong performance given the fear of a recession leading to slowing demand, slower economic growth, and manufacturing cost rising along with input cost.
We attribute the improving fundamental outlooks that spearheaded the mega-cap tech rally year-to-date. During 2022, analysts slashed mega-cap tech firms’ 2023 EPS estimates by an average of 27% as growth decelerated sharply amid post-pandemic normalization. But 1Q 2023 results for mega-cap tech have been better than feared with sales, earnings, and margins beating consensus and prompting upward EPS revisions. Also, we believe their long-term prospects potentially stand to benefit from advances in generative AI. Anecdotal evidence of long-term growth prospects for AI is 1) the first-quarter earnings season underlined the growth potential of artificial intelligence, and 2) Alphabet and Microsoft mentioned AI more than 50 times each during their quarterly earnings conference calls. This underlines the view that the broad AI hardware market is en-route to achieving a 20% compound annual growth rate to reach US$90b by 2025. We see AI as a horizontal technology that will have important use across various applications and industries, benefiting multi-industries.
Furthermore, the recent macro environment has also supported mega-cap tech stocks’ outperformance. While the sharp increase in interest rates during 2022 was a clear headwind for these biggest tech stocks, treasury yields have declined this year as economic growth has slowed, partly helping to explain the rally of these tech stocks. Nevertheless, investors should remain mindful that these tech stocks could be volatile during economic uncertainties. As the Fed continues to keep monetary policy tight and the cost of capital remains elevated, we believe that these mega-cap tech companies, through their market leadership, brand equity, economies of scale, and high cash balance will be able to better navigate this landscape. Thus, we hold the opinion that investors should continue to build long-term exposure to high-growth themes in the tech sector. In the near term, investors should also consider rotating into less expensive and quality parts of the sector. Note that these mega-cap tech stocks do possess quality traits.
Figure 4: Mega-cap Tech YTD Performance
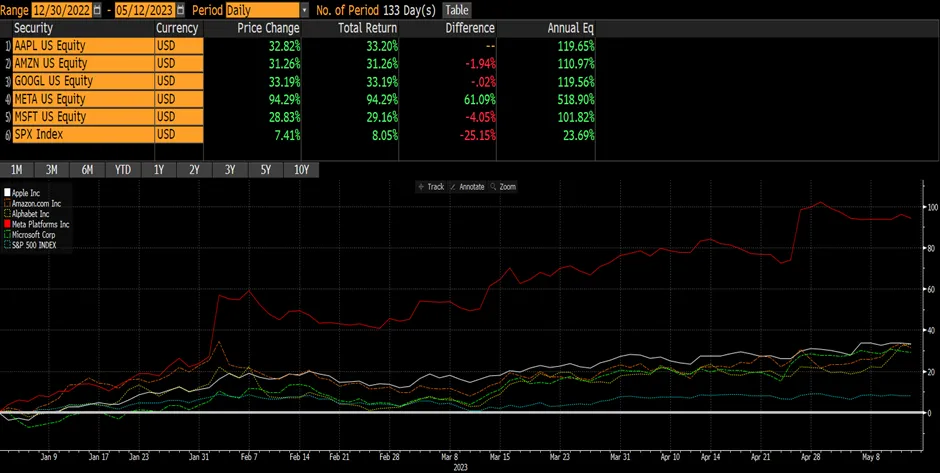 Source: Bloomberg
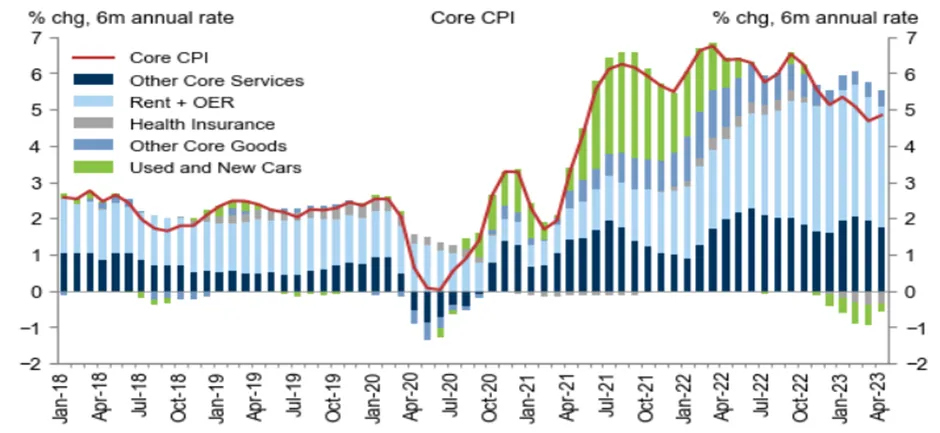
Although the US inflation eased up, market weakness persists. April core CPI rose 0.41%, slightly above consensus. However, the composition was softer, as used cars contributed +0.14pp and wholesale prices in that category are now falling. Additionally, the March slowdown in shelter categories was largely sustained in April, reflecting a waning boost from expiring pandemic rent concessions, and slowing growth in the new rental pricing. Core services prices excluding rent and OER rose just 0.11%, though this probably understates the trend due to a large April drag from travel categories. This report is supportive of a pause in interest rate hikes at the June FOMC meeting, which the market is expecting. Yet, the market didn’t react positively to it either.
Figure 5: Core CPI
 Source: Department of Labour
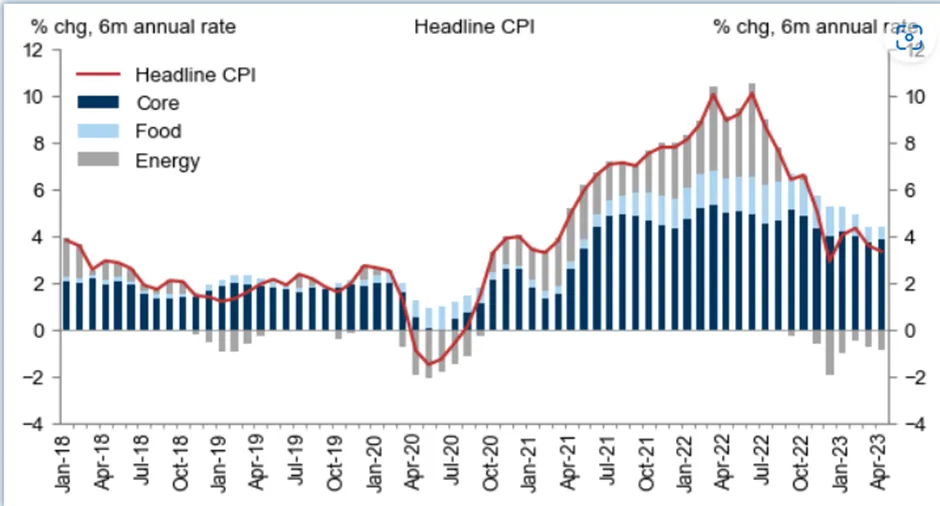
Figure 6: Headline CPI
 Source: Department of Labour
We believe data from the US such as easing core CPI, stronger than expected earnings, the Fed's Senior Loan Officer Survey reported less credit tightening than expected, and strong US labour market data remains supportive of the US economy and of broader cross-asset pricing of cyclical growth.
Unlike the US, China’s data for April deteriorated with import, inflation, and bank lending data coming in weaker than expected.
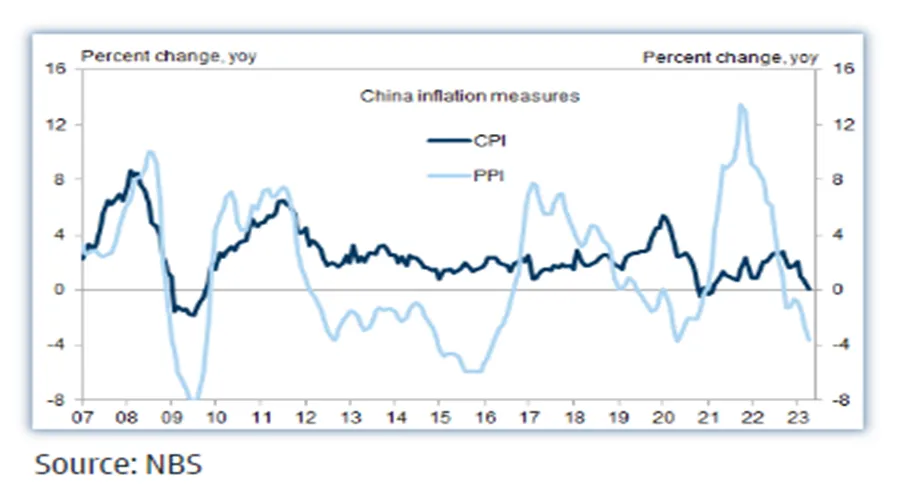
China's headline CPI inflation fell to +0.1% YoY in April from +0.7% in March primarily on a high base from last April’s Shanghai Covid lockdowns and supply disruptions. In month-on-month terms, headline CPI declined 2.2% (annualized, seasonally adjusted) in April (vs. +6.7% in March).
Producer Price Index inflation fell to -3.6% YoY in April from -2.5% in March primarily on a high base of commodity prices. In month-over-month terms, PPI fell 4.2% (annualized, seasonally adjusted) in April (vs. +2.5% in March). PPI inflation in producer goods fell to -4.7% YoY in April from -3.4% in March, and PPI inflation in consumer goods moderated to +0.4% in April (vs. +0.9% in March). NBS commented that weak domestic/external demand drove down PPIs of upstream sectors, such as petrol, coking coals, and metal sectors. After excluding the impacts of high bases last year, weak domestic/external demand continued to weigh on CPI/PPI in the form of falling crude oil prices and price cuts of durable goods. Looking ahead, we would expect headline CPI inflation to accelerate in the coming months on continued economic recovery, while PPI deflation may continue in the coming months as input cost declines.
Figure 7: China CPI and PPI
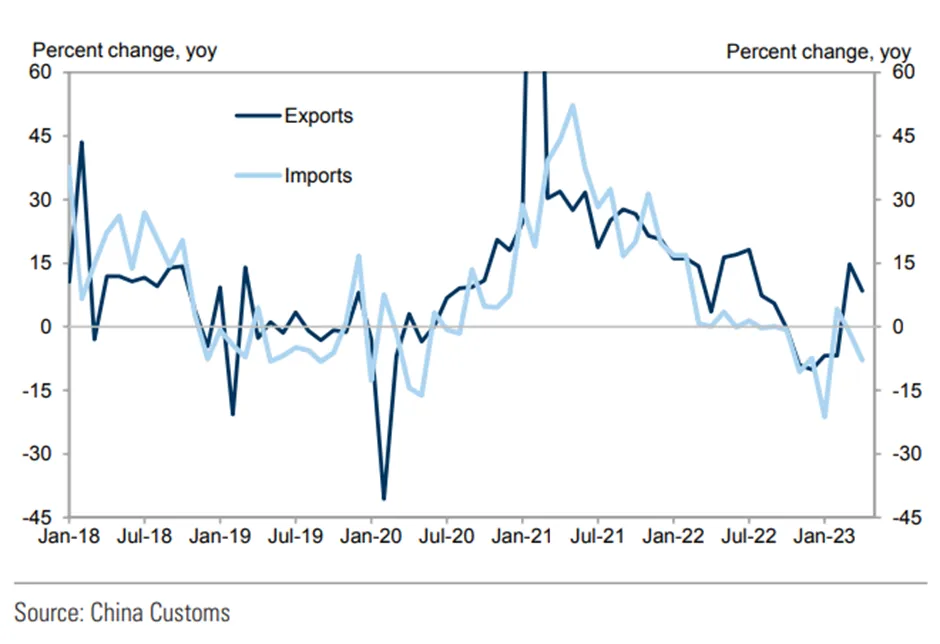
Another weak data from China was both export and import which saw value decline significantly in April in sequential terms (exports: -5.4%, imports: -5.1%). Although on YoY terms, export growth was slightly above consensus, while import growth was well below consensus. Export value declined sharply across major trading partners and products in sequential terms, likely due to a payback effect from frontloaded orders and/or residual seasonality. The import value of major commodities (such as crude oil and iron ore) and tech-related products (such as chips) declined sharply in sequential terms.
Figure 8: China’s Export and Imports Surprised Sharply To The Downside In April.
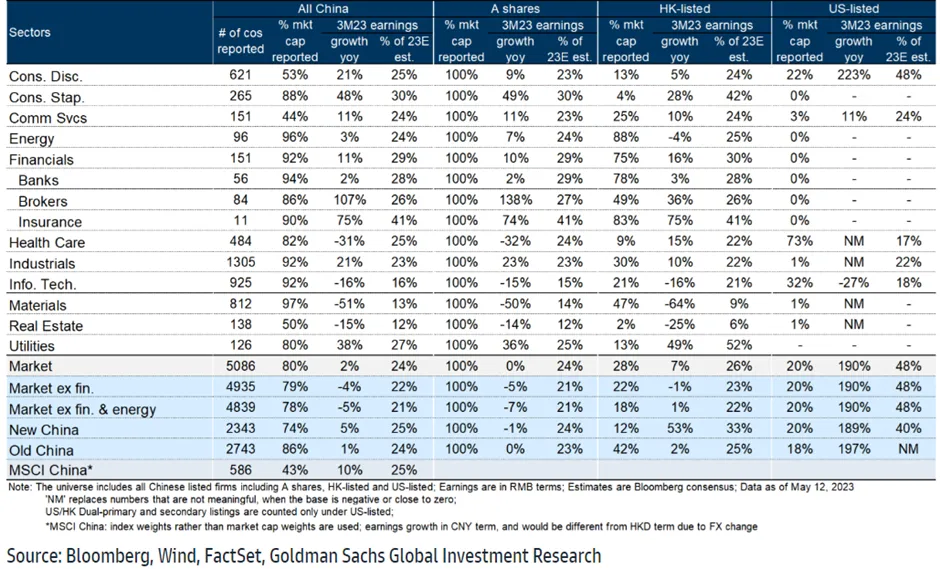
Earnings for Chinese companies in 1Q23 have also been disappointing. 80% of all China listed universe has reported thus far, with 1Q23 earnings rising by a mere 2% and accounting for 24% of the full-year estimates. Earnings surprises were below consensus expectations with 15% beats vs 69% misses. Based on the companies that reported 1Q earnings so far, ROE also edged down 40bps in 1Q23 vs 1Q22. ROE deterioration was mainly due to margin compression for the ex-financial universe.
Figure 9: Disappointing 1Q23 Earnings Season For China
In summary, data coming out from the US should continue to be supportive of better market performances over China. The stronger growth of China is merely coming off a low base in the previous year thus in our opinion, an optics effect. We would favour the developed markets (ie the US/Europe) over China at this point and continue to focus on those companies with quality factors.