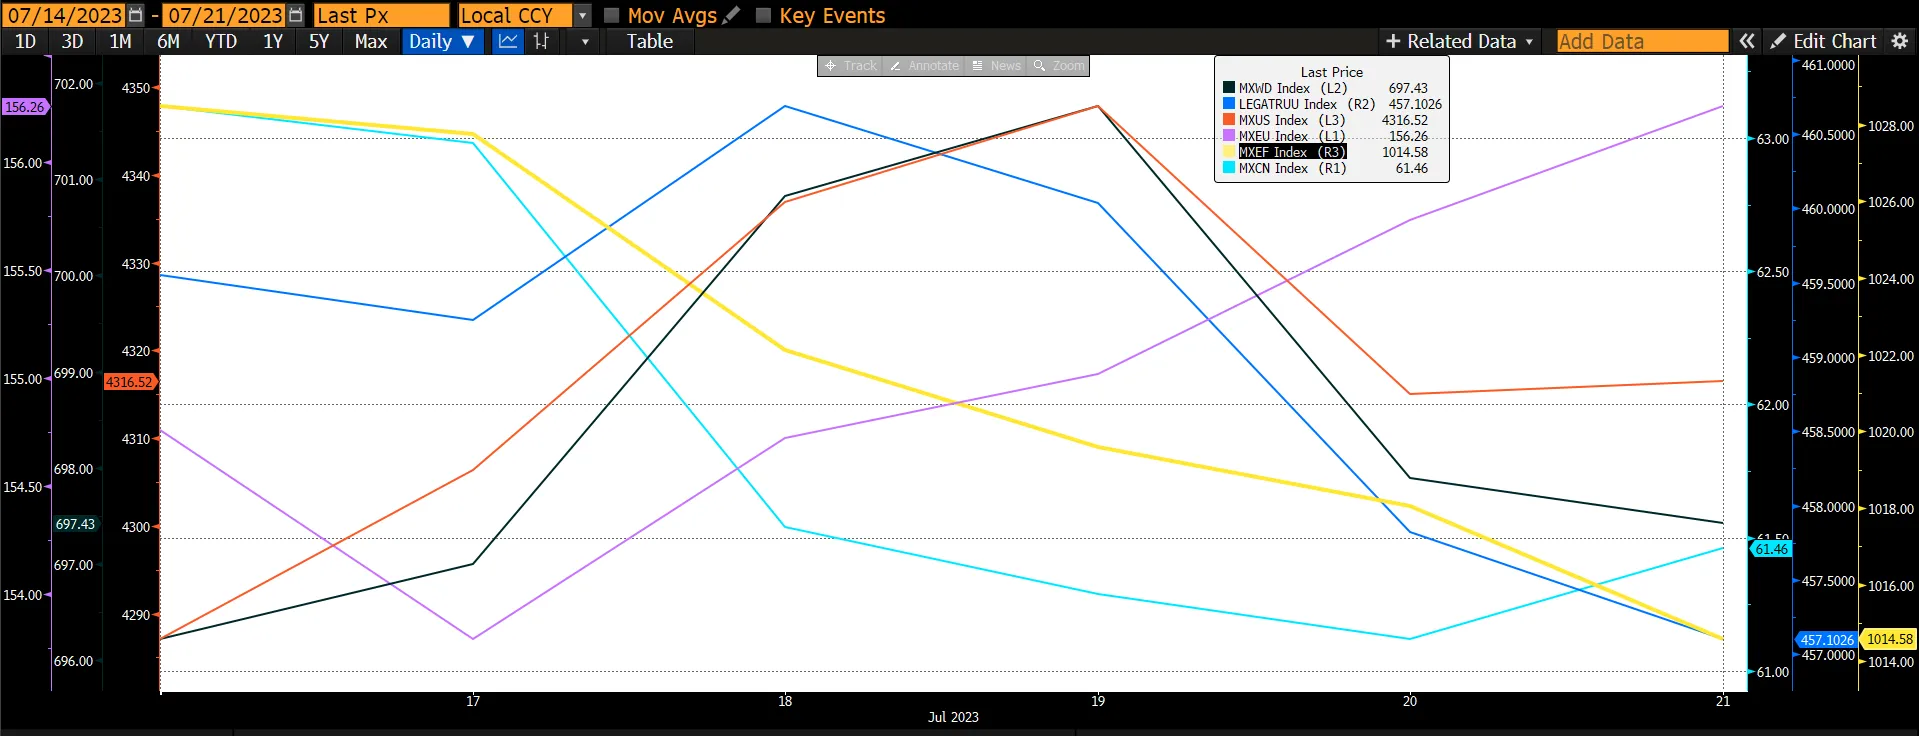
The global equity market rose by a mere 0.19% for the week ending 21 July 2023 led by MXUS rising by 0.70%. The US market remains resilient as the probability of a recession has been lowered resulting from recent data releases suggesting inflation is cooling. All other markets saw a decline led by emerging markets (-1.31%) resulting from China’s fall of 2.61%. The weakness in the Chinese market follows the 6.28% rise in the previous week. The global fixed income index fell by 0.53% due to expectations of the Fed hiking interest rates by 25bps on 27 July. All eyes will be on the earnings season, Fed meeting, and expectations of China announcing stimulus to prop up the slowing economy at next week’s Central Politburo meeting.
Figure 1: Major Indices Performance
US economic activity remains resilient, with 2Q23 GDP growth tracking 2.3%, consumer sentiment rebounding sharply from depressed levels, unemployment falling back to 3.56% in June, and initial jobless claims reversing its most recent mini-spike. We do expect some deceleration in the next few quarters, mostly because of sequentially slower real disposable personal income growth and a drag from reduced bank lending. But the easing in financial conditions, the rebound in the housing market, and the ongoing boom in factory building all suggest that the US economy will continue to grow, albeit at a below-trend pace.
US retail sales increased 0.2% MoM in June, as a 1.4% decline in gas station sales and a 1.2% drop for building materials stores were more than offset by strength in core categories. Core retail sales (ex. autos, gasoline, and building materials) rose 0.6%, above expectations, and the level of core retail sales was revised up in prior months (May level +0.10%, April level +0.02%). Retail sales declined again for food and beverage stores (-0.7%), reflecting expiring pandemic food stamp benefits.
Industrial production fell by 0.5% in June, below consensus expectations for a flat reading. Auto assemblies declined by 0.6m to 11.0m units, compared to 10.9m on average in 2019. Manufacturing production declined 0.3%, also below consensus expectations. The capex-sensitive business equipment category was flat in June. Capacity utilization decreased by 0.5pp to 78.9% from a downward revised level in May (-0.2pp to 79.4%).
Business inventories rose 0.2% MoM in May, in line with consensus expectations. Inventories increased at retailers (+0.7%), were unchanged at merchant wholesalers, and declined at manufacturers (-0.2%). Ex-auto inventories declined by 0.1%.
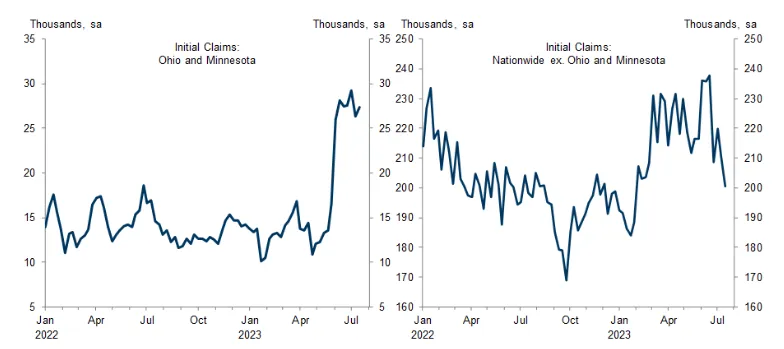
Initial jobless claims fell by 9k to 228k in the week ended July 15, against consensus expectations for a slight increase. The four-week moving average of claims fell by 9k to 238k. Two distortions that likely boosted initial claims over the last few weeks - potentially fraudulent filings in Ohio and expanded eligibility for unemployment insurance in Minnesota - appeared to persist in today’s report. Those two states accounted for 27k initial claims (vs. 26k in the prior week and 14k in late May). After adjusting for those distortions, initial claims remained near levels last seen in February, though a favourable seasonal comparison likely contributed to the sequential decline.
Figure 2: Jobless Claims
 Source: Department of Labour
The Philadelphia Fed manufacturing index increased by 0.2pt to -13.5 in July, below consensus expectations. The composition of the report was weak, as the shipments (-22.4pt to -12.5), new orders (-4.9pt to -15.9), and employment (-0.6pt to -1.0) components each declined. The prices paid measure edged down by 1.0pt to 9.5, while the prices received measure increased dramatically (+22.9pt to 23.0). The delivery time component increased but remained negative (+3.2pt to -12.9), indicating that delivery times continued to decline. The 6 months-ahead business conditions index however increased by 16.4pt to +29.1 suggesting optimism in the business outlook for the remainder of the year.
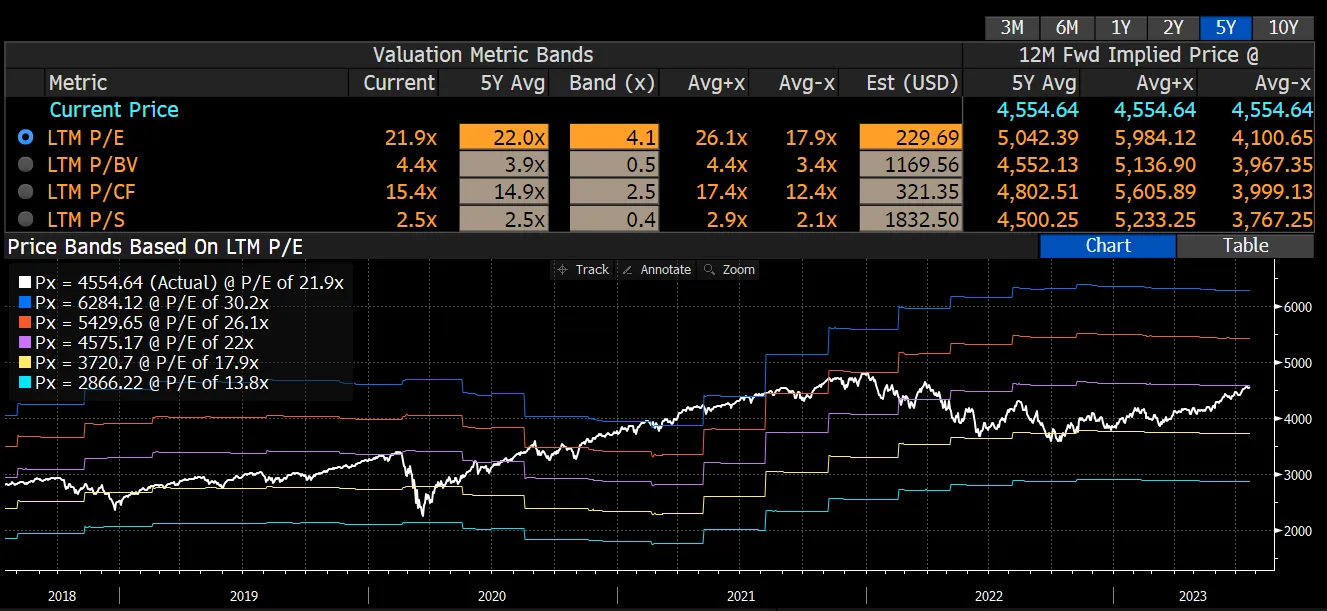
That said, the outlook for the US economy still points to slowing economic growth, and many strategists believe that the equity market is becoming too rich for their liking. There are signs that the hottest sectors of the market may be starting to cool off, while the lagging sectors are warming up. Thus, we hold the opinion that there would be further upside for the S&P 500 driven by other than the tech sector (mega-cap stocks). Investors should begin investing in S&P 500’s 2024 earnings growth recovery (expectation of 11.8% growth) and ROE is forecast to further expand in 2024 to 18.45% from 17.86% in 2023. The current market valuation, in our opinion, is deemed to be fair rather than rich as it is trading at 21.9x, similar to the 5-year average).
Figure 3: S&P 500 PE Band
 Source: Bloomberg
China’s economy lost recovery momentum in 2Q23. June activity data also showed retail sales losing steam faster than expected suggesting weakness could carry into 3Q23. A pick-up in industrial production points to some stabilization in the manufacturing sector, a sign that the economy’s growth engine is shifting from consumption to production. But flagging domestic and external demand are obstacles to sustaining the recovery. The weak data strengthens the case for more policy support which the market is anticipating.
GDP growth accelerated to 6.3% YoY in 2Q23 from 4.5% in 1Q23. This is far short of the consensus forecast of 7.1%. The pickup largely reflected a lower base of comparison. In QoQ terms, the economy expanded just 0.8%, down sharply from 2.2% growth in 1Q23. That was half the average pace (1.6%) over the 2015-2019 period. This highlights the weakness in the post-Covid recovery.
Figure 4: China GDP and Activity
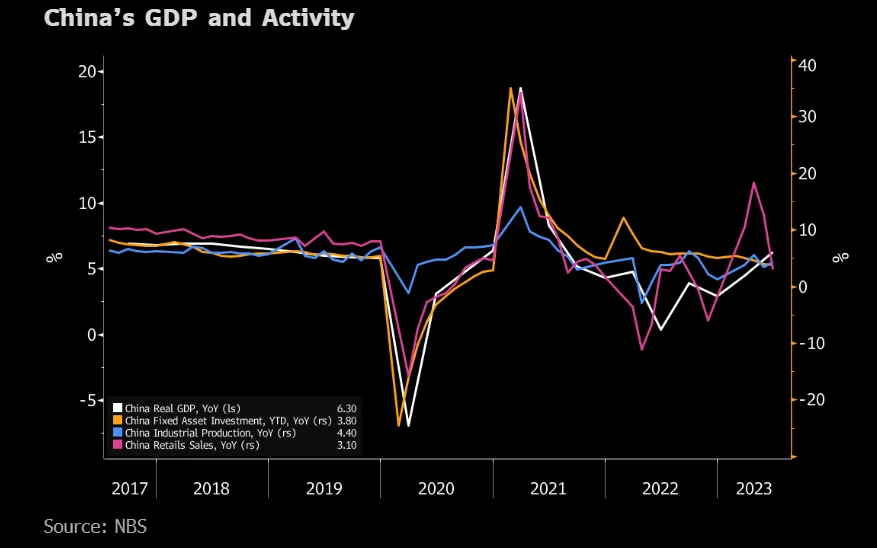
Retail sales growth slumped to just 3.1% YoY in June, down from 12.7% in May. This was also below the consensus forecast of 3.3%. MoM growth in retail sales slowed to 0.23% from 0.39% in May, well below the average of 0.76% over 2015-2019.
Industrial production unexpectedly picked up to 4.4% in June from 3.5% in May.
Fixed Asset investment growth decelerated to 3.8% YoY in the first half of 2023 from 4% in the first 5 months of the year.
Given the numerous growth headwinds in the Chinese economy at present and the market's memory of the government's "growth slowdown followed by massive stimulus" old playbook, there have been heated debates on whether, when, how much, and in what way policymakers may stimulate the economy. Most recently, the government has announced plans to boost auto and electronics consumption, implement shantytown renovation in mega-cities, and support private businesses. At next week’s Politburo meeting, there are expectations of the government to convey an easing bias while continuing to emphasize the "high-quality growth" model. With the leadership placing more focus on security and sustainability than near-term GDP growth, the policy stimulus will come in different forms and magnitudes than before. We would prefer to adopt a “wait-and-see” approach before decisively overweighting China. In the meantime, we remain selective in China.
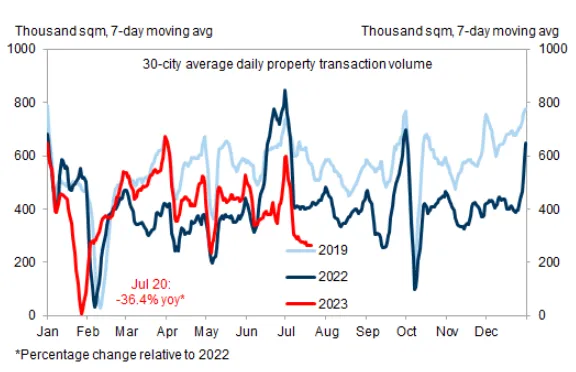
Figure 5: 30-City Property Sales Volume Weakened in July MT
 Source: Wind
Following Janet Yellen's visit to China and in an interview with Bloomberg, she cited that China’s economic slowdown risks causing ripple effects across the global economy, though she doesn’t expect a recession in the US. “Many countries do depend on strong Chinese growth to promote growth in their own economies, particularly countries in Asia – and slow growth in China can have some negative spillovers for the US”.
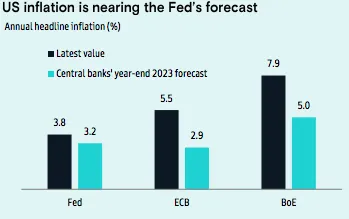
On the fixed income front, US Treasury yields retraced some of their recent rallies. 10-year yields ended the week flat, but 2-year yields rose 6 basis points (bps). Economic data were mostly stronger, with jobless claims falling to a two-month low after briefly spiking in June. Housing market data were softer, with new starts, building permits, and existing home sales declining. Finally, retail sales were mixed. The headline number disappointed, but the Fed is making the best progress among other central banks to fight inflation. Markets continue to price in almost 100% odds of a Fed rate hike at this week’s policy meeting, followed by a roughly one-in-three chance of an additional hike later this year.
Figure 6: Inflation Nearing Fed’s Forecast
 Source: Goldman Sachs
Investment grade corporates rallied again, returning 0.2% for the week and beating similar-duration Treasuries by 20bps. Economic releases over the past several days had largely cheered investors. The University of Michigan’s consumer sentiment index for July rose to its highest level for 22 months, while a separate report on import prices showed a fall in annual prices, down 6.1% in June. Yield levels were flat for the week, though spreads tightened -2bps. Inflows continued at $302m, though they decelerated to the slowest pace since March 2023. Attention was focused on the new issue calendar of $29b, with around two-thirds of that amount concentrated from three major bank issuers: JPMorgan, Wells Fargo, and Morgan Stanley.
High-yield corporates rallied, returning 0.11% and outperforming similar-duration Treasuries by 20bps on positive economic data. Senior loans advanced, returning 0.08%. Lower-quality names outperformed in both markets, led by CCC-rated corporates. Both markets saw continued inflows of $2.2b and $237m, respectively. Meanwhile, new issuance picked up as well, with $2.8b of new supply in the high-yield market and $9.1b in loans.
Emerging markets gained, returning 0.12% and beating similar-duration Treasuries by 16bps, given improved economic data across the countries (except China). Spreads were generally tighter across both investment grade and high-yield names. After three weeks of outflows, inflows returned to the asset class, with hard currency and local funds seeing inflows of $107m and $128m, respectively. In contrast to U.S. corporates, issuance was on the lighter side, with only $4.5 billion coming to market for the week.

